

152
Vertical Structure: Baroclinic Quasi-Geostrophic Models
(
)
[6( -
) OWE(!) ]'
13
Dmax = D Xw, 1 =
Xe
Xw
0 Y
·
(3.10.25)
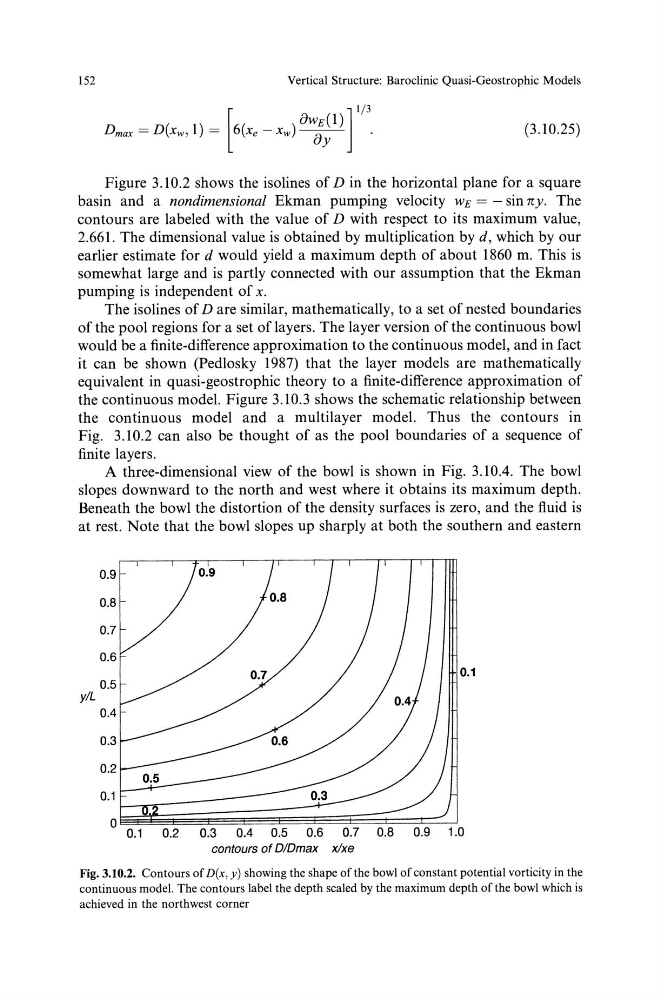
Figure 3.10.2 shows the isolines of D in the horizontal plane for a square
basin and a nondimensional Ekman pumping velocity wE=- sin ny. The
contours are labeled with the value of D with respect to its maximum value,
2.661. The dimensional value is obtained by multiplication by d, which by our
earlier estimate ford would yield a maximum depth of about 1860 m. This is
somewhat large and is partly connected with our assumption that the Ekman
pumping is independent of x.
The isolines of Dare similar, mathematically, to a set of nested boundaries
of the pool regions for a set of layers. The layer version of the continuous bowl
would be a finite-difference approximation to the continuous model, and in fact
it can be shown (Pedlosky 1987) that the layer models are mathematically
equivalent in quasi-geostrophic theory to a finite-difference approximation of
the continuous model. Figure 3.10.3 shows the schematic relationship between
the continuous model and a multilayer model. Thus the contours in
Fig. 3.10.2 can also be thought of as the pool boundaries of a sequence of
finite layers.
A three-dimensional view of the bowl is shown in Fig. 3.10.4. The bowl
slopes downward to the north and west where it obtains its maximum depth.
Beneath the bowl the distortion of the density surfaces is zero, and the fluid is
at rest. Note that the bowl slopes up sharply at both the southern and eastern
0.1
0.1
0.2
0.3
0.4 0.5 0.6 0. 7 0.8
0.9 1.0
contours of D/Dmax xlxe
Fig. 3.10.2. Contours of D(x, y) showing the shape of the bowl of constant potential vorticity in the
continuous model. The contours label the depth scaled by the maximum depth of the bowl which is
achieved in the northwest corner
Vertical Structure: Baroclinic Quasi-Geostrophic Models
(
)
[6( -
) OWE(!) ]'
13
Dmax = D Xw, 1 =
Xe
Xw
0 Y
·
(3.10.25)
Figure 3.10.2 shows the isolines of D in the horizontal plane for a square
basin and a nondimensional Ekman pumping velocity wE=- sin ny. The
contours are labeled with the value of D with respect to its maximum value,
2.661. The dimensional value is obtained by multiplication by d, which by our
earlier estimate ford would yield a maximum depth of about 1860 m. This is
somewhat large and is partly connected with our assumption that the Ekman
pumping is independent of x.
The isolines of Dare similar, mathematically, to a set of nested boundaries
of the pool regions for a set of layers. The layer version of the continuous bowl
would be a finite-difference approximation to the continuous model, and in fact
it can be shown (Pedlosky 1987) that the layer models are mathematically
equivalent in quasi-geostrophic theory to a finite-difference approximation of
the continuous model. Figure 3.10.3 shows the schematic relationship between
the continuous model and a multilayer model. Thus the contours in
Fig. 3.10.2 can also be thought of as the pool boundaries of a sequence of
finite layers.
A three-dimensional view of the bowl is shown in Fig. 3.10.4. The bowl
slopes downward to the north and west where it obtains its maximum depth.
Beneath the bowl the distortion of the density surfaces is zero, and the fluid is
at rest. Note that the bowl slopes up sharply at both the southern and eastern
0.1
0.1
0.2
0.3
0.4 0.5 0.6 0. 7 0.8
0.9 1.0
contours of D/Dmax xlxe
Fig. 3.10.2. Contours of D(x, y) showing the shape of the bowl of constant potential vorticity in the
continuous model. The contours label the depth scaled by the maximum depth of the bowl which is
achieved in the northwest corner