

188
Carl Wunsch
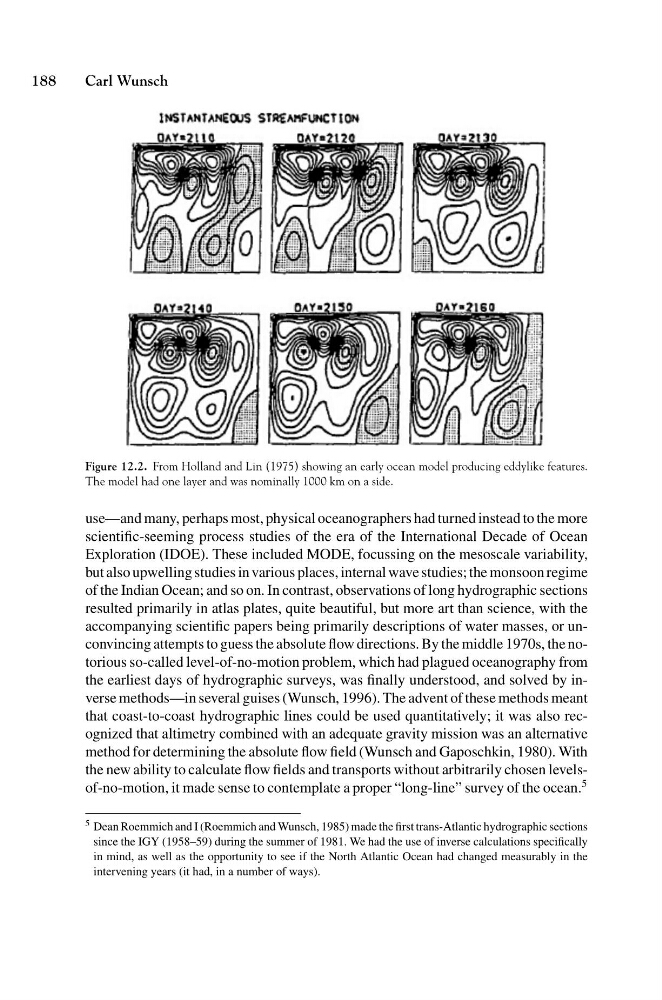
Figure 12.2. From Holland and Lin (1975) showing an early ocean model producing eddylike features.
The model had one layer and was nominally 1000 km on a side.
use—and many, perhaps most, physical oceanographers had turned instead to the more
scientific-seeming process studies of the era of the International Decade of Ocean
Exploration (IDOE). These included MODE, focussing on the mesoscale variability,
but also upwelling studies in various places, internal wave studies; the monsoon regime
of the Indian Ocean; and so on. In contrast, observations of long hydrographic sections
resulted primarily in atlas plates, quite beautiful, but more art than science, with the
accompanying scientific papers being primarily descriptions of water masses, or unconvincing attempts to guess the absolute flow directions. By the middle 1970s, the notorious so-called level-of-no-motion problem, which had plagued oceanography from
the earliest days of hydrographic surveys, was finally understood, and solved by inverse methods—in several guises (Wunsch, 1996). The advent of these methods meant
that coast-to-coast hydrographic lines could be used quantitatively; it was also recognized that altimetry combined with an adequate gravity mission was an alternative
method for determining the absolute flow field (Wunsch and Gaposchkin, 1980). With
the new ability to calculate flow fields and transports without arbitrarily chosen levelsof-no-motion, it made sense to contemplate a proper “long-line” survey of the ocean.
5
5 Dean Roemmich and I (Roemmich and Wunsch, 1985) made the first trans-Atlantic hydrographic sections
since the IGY (1958–59) during the summer of 1981. We had the use of inverse calculations specifically
in mind, as well as the opportunity to see if the North Atlantic Ocean had changed measurably in the
intervening years (it had, in a number of ways).
Carl Wunsch
Figure 12.2. From Holland and Lin (1975) showing an early ocean model producing eddylike features.
The model had one layer and was nominally 1000 km on a side.
use—and many, perhaps most, physical oceanographers had turned instead to the more
scientific-seeming process studies of the era of the International Decade of Ocean
Exploration (IDOE). These included MODE, focussing on the mesoscale variability,
but also upwelling studies in various places, internal wave studies; the monsoon regime
of the Indian Ocean; and so on. In contrast, observations of long hydrographic sections
resulted primarily in atlas plates, quite beautiful, but more art than science, with the
accompanying scientific papers being primarily descriptions of water masses, or unconvincing attempts to guess the absolute flow directions. By the middle 1970s, the notorious so-called level-of-no-motion problem, which had plagued oceanography from
the earliest days of hydrographic surveys, was finally understood, and solved by inverse methods—in several guises (Wunsch, 1996). The advent of these methods meant
that coast-to-coast hydrographic lines could be used quantitatively; it was also recognized that altimetry combined with an adequate gravity mission was an alternative
method for determining the absolute flow field (Wunsch and Gaposchkin, 1980). With
the new ability to calculate flow fields and transports without arbitrarily chosen levelsof-no-motion, it made sense to contemplate a proper “long-line” survey of the ocean.
5
5 Dean Roemmich and I (Roemmich and Wunsch, 1985) made the first trans-Atlantic hydrographic sections
since the IGY (1958–59) during the summer of 1981. We had the use of inverse calculations specifically
in mind, as well as the opportunity to see if the North Atlantic Ocean had changed measurably in the
intervening years (it had, in a number of ways).