

Ocean Acoustic Tomography
135
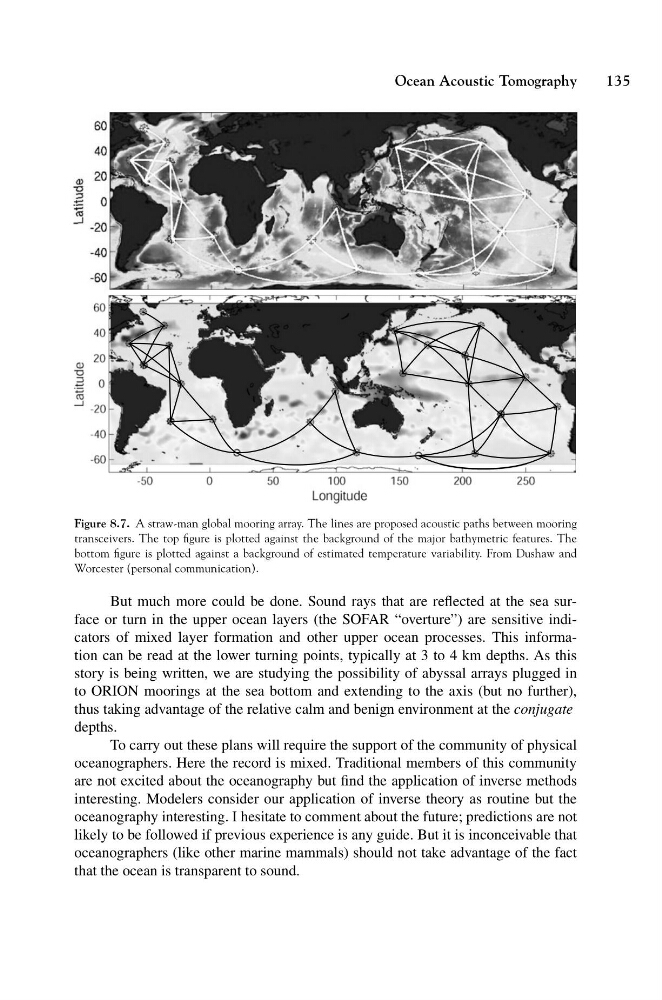
Figure 8.7. A straw-man global mooring array. The lines are proposed acoustic paths between mooring
transceivers. The top figure is plotted against the background of the major bathymetric features. The
bottom figure is plotted against a background of estimated temperature variability. From Dushaw and
Worcester (personal communication).
But much more could be done. Sound rays that are reflected at the sea surface or turn in the upper ocean layers (the SOFAR “overture”) are sensitive indicators of mixed layer formation and other upper ocean processes. This information can be read at the lower turning points, typically at 3 to 4 km depths. As this
story is being written, we are studying the possibility of abyssal arrays plugged in
to ORION moorings at the sea bottom and extending to the axis (but no further),
thus taking advantage of the relative calm and benign environment at the conjugate
depths.
To carry out these plans will require the support of the community of physical
oceanographers. Here the record is mixed. Traditional members of this community
are not excited about the oceanography but find the application of inverse methods
interesting. Modelers consider our application of inverse theory as routine but the
oceanography interesting. I hesitate to comment about the future; predictions are not
likely to be followed if previous experience is any guide. But it is inconceivable that
oceanographers (like other marine mammals) should not take advantage of the fact
that the ocean is transparent to sound.
135
Figure 8.7. A straw-man global mooring array. The lines are proposed acoustic paths between mooring
transceivers. The top figure is plotted against the background of the major bathymetric features. The
bottom figure is plotted against a background of estimated temperature variability. From Dushaw and
Worcester (personal communication).
But much more could be done. Sound rays that are reflected at the sea surface or turn in the upper ocean layers (the SOFAR “overture”) are sensitive indicators of mixed layer formation and other upper ocean processes. This information can be read at the lower turning points, typically at 3 to 4 km depths. As this
story is being written, we are studying the possibility of abyssal arrays plugged in
to ORION moorings at the sea bottom and extending to the axis (but no further),
thus taking advantage of the relative calm and benign environment at the conjugate
depths.
To carry out these plans will require the support of the community of physical
oceanographers. Here the record is mixed. Traditional members of this community
are not excited about the oceanography but find the application of inverse methods
interesting. Modelers consider our application of inverse theory as routine but the
oceanography interesting. I hesitate to comment about the future; predictions are not
likely to be followed if previous experience is any guide. But it is inconceivable that
oceanographers (like other marine mammals) should not take advantage of the fact
that the ocean is transparent to sound.