

Sea-Surface Temperature Estimations Using a Modem Analog Technique
81
two cores with narrow temperature ranges of -1°C
or less: clusters 3 and 4 in GeoB 1312, and clusters 4 and 7 in GeoB 1309. The wider temperature
ranges indicate that samples containing fairly similar
assemblages can represent areas with significant
differences in surface-water temperature estimates, leading us to believe that fairly stable species assemblages, with small variations in the abundances of a few key species, can exist over relatively wide temperature ranges.
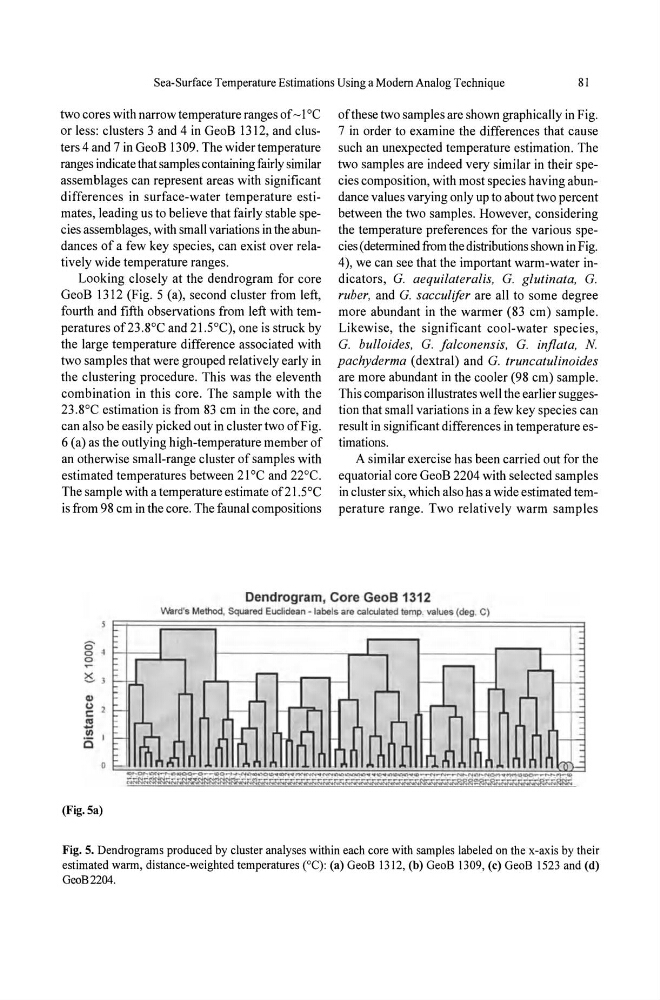
Looking closely at the dendrogram for core
GeoB 1312 (Fig. 5 (a), second cluster from left,
fourth and fifth observations from left with temperatures of23 .8°C and 2 I. 5°C), one is struck by
the large temperature difference associated with
two samples that were grouped relatively early in
the clustering procedure. This was the eleventh
combination in this core. The sample with the
23 .8°C estimation is from 83 cm in the core, and
can also be easily picked out in cluster two of Fig.
6 (a) as the outlying high-temperature member of
an otherwise small-range cluster of samples with
estimated temperatures between 21°C and 22°C.
The sample with a temperature estimate of21.SoC
is from 98 cm in the core. The faunal compositions
of these two samples are shown graphically in Fig.
7 in order to examine the differences that cause
such an unexpected temperature estimation . The
two samples are indeed very similar in their species composition, with most species having abundance values varying only up to about two percent
between the two samples. However, considering
the temperature preferences for the various species (determined from the distributions shown in Fig.
4), we can see that the important warm-water indicators, G. aequilateralis, G. glutinata, G.
ruber, and G. sacculifer are all to some degree
more abundant in the warmer (83 cm) sample.
Likewise, the significant cool-water species,
G. bulloides, G. falconensis , G. inflata, N.
pachyderma (dextral) and G. truncatulinoides
are more abundant in the cooler (98 cm) sample.
This comparison illustrates well the earlier suggestion that small variations in a few key species can
result in significant differences in temperature estimations.
A similar exercise has been carried out for the
equatorial core GeoB 2204 with selected samples
in cluster six, which also has a wide estimated temperature range. Two relatively warm samples
Dendrogram, Core GeoB 1312
ward's Method, Squared Euclidean -labels are calculated temp. values (deg. C)
§4 8 ir=L...,
~ J
41
U
s:::
'"
- VI
i5
(Fig. Sa)
Fig. 5. Dendrograms produced by cluster analyses within each core with samples labeled on the x-axis by their
estimated warm, distance-weighted temperatures (0C): (a) GeoB 1312, (b) GeoB 1309, (c) GeoB 1523 and (d)
GeoB2204.
81
two cores with narrow temperature ranges of -1°C
or less: clusters 3 and 4 in GeoB 1312, and clusters 4 and 7 in GeoB 1309. The wider temperature
ranges indicate that samples containing fairly similar
assemblages can represent areas with significant
differences in surface-water temperature estimates, leading us to believe that fairly stable species assemblages, with small variations in the abundances of a few key species, can exist over relatively wide temperature ranges.
Looking closely at the dendrogram for core
GeoB 1312 (Fig. 5 (a), second cluster from left,
fourth and fifth observations from left with temperatures of23 .8°C and 2 I. 5°C), one is struck by
the large temperature difference associated with
two samples that were grouped relatively early in
the clustering procedure. This was the eleventh
combination in this core. The sample with the
23 .8°C estimation is from 83 cm in the core, and
can also be easily picked out in cluster two of Fig.
6 (a) as the outlying high-temperature member of
an otherwise small-range cluster of samples with
estimated temperatures between 21°C and 22°C.
The sample with a temperature estimate of21.SoC
is from 98 cm in the core. The faunal compositions
of these two samples are shown graphically in Fig.
7 in order to examine the differences that cause
such an unexpected temperature estimation . The
two samples are indeed very similar in their species composition, with most species having abundance values varying only up to about two percent
between the two samples. However, considering
the temperature preferences for the various species (determined from the distributions shown in Fig.
4), we can see that the important warm-water indicators, G. aequilateralis, G. glutinata, G.
ruber, and G. sacculifer are all to some degree
more abundant in the warmer (83 cm) sample.
Likewise, the significant cool-water species,
G. bulloides, G. falconensis , G. inflata, N.
pachyderma (dextral) and G. truncatulinoides
are more abundant in the cooler (98 cm) sample.
This comparison illustrates well the earlier suggestion that small variations in a few key species can
result in significant differences in temperature estimations.
A similar exercise has been carried out for the
equatorial core GeoB 2204 with selected samples
in cluster six, which also has a wide estimated temperature range. Two relatively warm samples
Dendrogram, Core GeoB 1312
ward's Method, Squared Euclidean -labels are calculated temp. values (deg. C)
§4 8 ir=L...,
~ J
41
U
s:::
'"
- VI
i5
(Fig. Sa)
Fig. 5. Dendrograms produced by cluster analyses within each core with samples labeled on the x-axis by their
estimated warm, distance-weighted temperatures (0C): (a) GeoB 1312, (b) GeoB 1309, (c) GeoB 1523 and (d)
GeoB2204.