

80
Hale and Pflaumann
16 -
~14
G. tenelius
~
0
'OJ' 12
g 10
ro
"0
8
C
:::J
.0 6
«
Cii
4
0:: 2
18
20
22
24
26
Estimated Temp.
8
~
0
G. conglobatus
'OJ'6
(J
c
+ +
ro
-g4
:::J
.0
« --,2
Q)
0::
0
18
20
22
24
26
Estimated Temp.
12
~ 10
G. rubescens
+*
28
+~
+
+
28
+
+
Q)
~
g
+*
i 6j ::r. .. : 1+ 1
~ 4 -,
+
++.+ ~
+
-Q)
I;
.++.,: +..: .+ ++
2
.+ + ! ... \+ +
0:::
+....
++
+ +
•
++
o
"
+
+I""+f'
18
20
22
24
26
28
Estimated Temp.
tures, or will the clusters be so pure that each will
represent its own exclusive range oftemperatures?
Presenting the clusters as dendrograms, however, does not provide a good visual representation
of the distribution oftemperatures among the clusters. Figs. 6 (a) through 6 (d) illustrate the contents
of each cluster in terms of the estimated tempera~
~
10 l
8
Q)
(J
c 6---i
ro
~
"0
c
4J
:::J
.0
«
Cii
0::
0
18
20
22
24
26
28
Estimated Temp.
10
~
~
O. universa
Q)
(J
c 6
ro
"0
C
:::J
4
.0
«
Cii 2
0::
18
20
22
24
26
28
Estimated Temp.
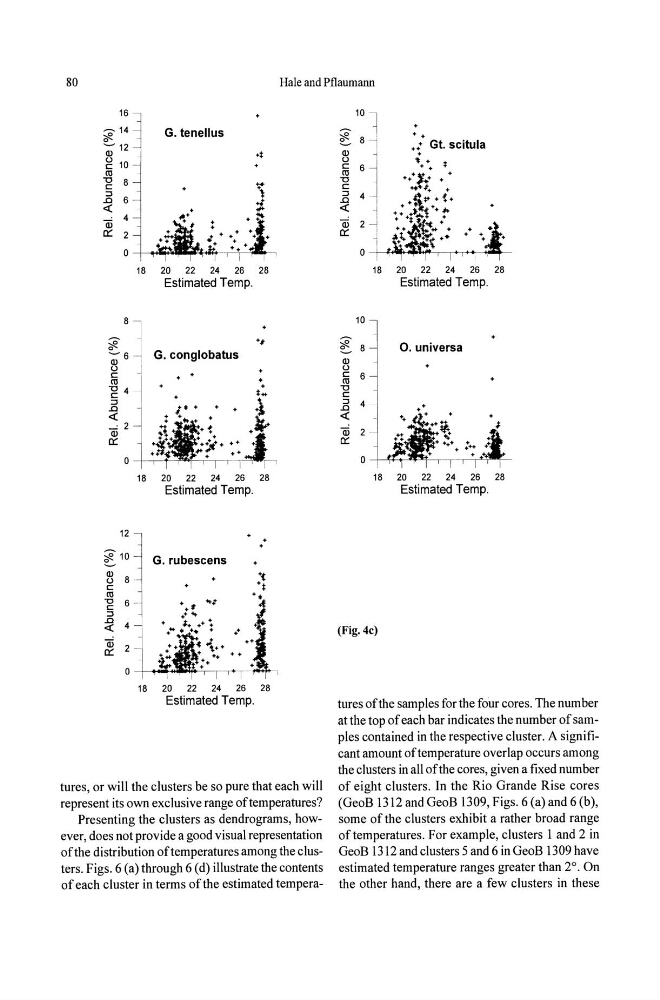
(Fig.4c)
tures ofthe samples for the four cores. The number
at the top of each bar indicates the number of samples contained in the respective cluster. A significant amount of temperature overlap occurs among
the clusters in all ofthe cores, given a fixed number
of eight clusters. In the Rio Grande Rise cores
(GeoB 1312 and GeoB 1309, Figs. 6 (a) and 6 (b),
some of the clusters exhibit a rather broad range
of temperatures. For example, clusters 1 and 2 in
GeoB 1312 and clusters 5 and 6 in GeoB 1309 have
estimated temperature ranges greater than 2°. On
the other hand, there are a few clusters in these
Hale and Pflaumann
16 -
~14
G. tenelius
~
0
'OJ' 12
g 10
ro
"0
8
C
:::J
.0 6
«
Cii
4
0:: 2
18
20
22
24
26
Estimated Temp.
8
~
0
G. conglobatus
'OJ'6
(J
c
+ +
ro
-g4
:::J
.0
« --,2
Q)
0::
0
18
20
22
24
26
Estimated Temp.
12
~ 10
G. rubescens
+*
28
+~
+
+
28
+
+
Q)
~
g
+*
i 6j ::r. .. : 1+ 1
~ 4 -,
+
++.+ ~
+
-Q)
I;
.++.,: +..: .+ ++
2
.+ + ! ... \+ +
0:::
+....
++
+ +
•
++
o
"
+
+I""+f'
18
20
22
24
26
28
Estimated Temp.
tures, or will the clusters be so pure that each will
represent its own exclusive range oftemperatures?
Presenting the clusters as dendrograms, however, does not provide a good visual representation
of the distribution oftemperatures among the clusters. Figs. 6 (a) through 6 (d) illustrate the contents
of each cluster in terms of the estimated tempera~
~
10 l
8
Q)
(J
c 6---i
ro
~
"0
c
4J
:::J
.0
«
Cii
0::
0
18
20
22
24
26
28
Estimated Temp.
10
~
~
O. universa
Q)
(J
c 6
ro
"0
C
:::J
4
.0
«
Cii 2
0::
18
20
22
24
26
28
Estimated Temp.
(Fig.4c)
tures ofthe samples for the four cores. The number
at the top of each bar indicates the number of samples contained in the respective cluster. A significant amount of temperature overlap occurs among
the clusters in all ofthe cores, given a fixed number
of eight clusters. In the Rio Grande Rise cores
(GeoB 1312 and GeoB 1309, Figs. 6 (a) and 6 (b),
some of the clusters exhibit a rather broad range
of temperatures. For example, clusters 1 and 2 in
GeoB 1312 and clusters 5 and 6 in GeoB 1309 have
estimated temperature ranges greater than 2°. On
the other hand, there are a few clusters in these