

0.0
0.2
0. 4
m/s
0.0
0.1
0.2
m/s
0.0
0.1
0.2
m/s
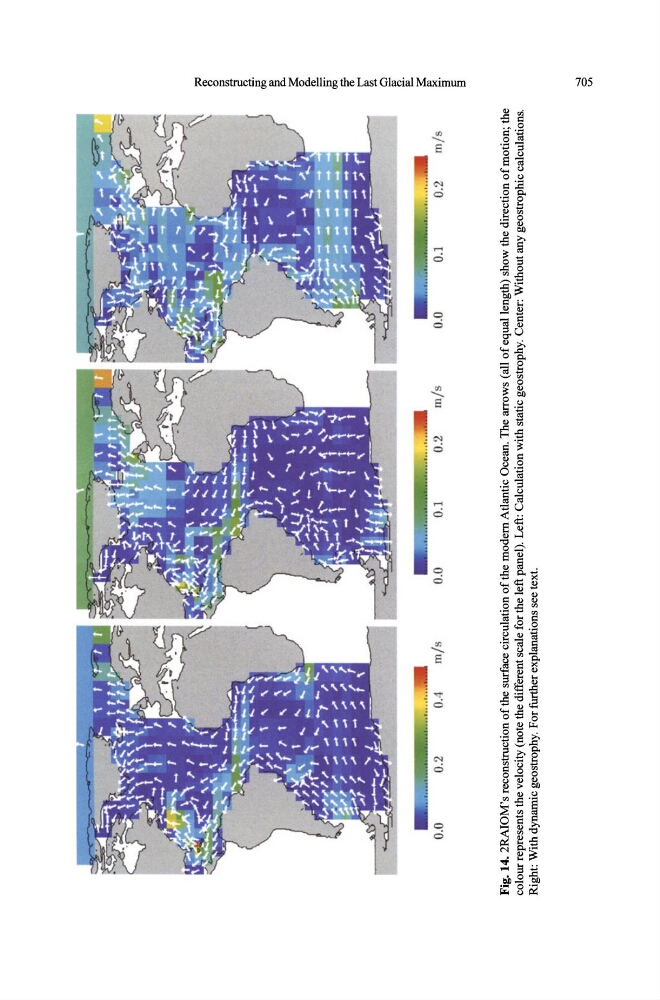
Fig. 14. 2RAIOM's reconstruction of the surface circulation of the modern Atlantic Ocean. The arrows (all of equal length) show the direction of motion; the
colour represents the velocity (note the different scale for the left panel). Left: Calculation with static geostrophy. Center: Without any geostrophic calculations.
Right: With dynamic geostrophy. For further explanations see text.
i
I.
Jg
8.
I
~
~
~
[
eo.
f
.....
o
v.
0.2
0. 4
m/s
0.0
0.1
0.2
m/s
0.0
0.1
0.2
m/s
Fig. 14. 2RAIOM's reconstruction of the surface circulation of the modern Atlantic Ocean. The arrows (all of equal length) show the direction of motion; the
colour represents the velocity (note the different scale for the left panel). Left: Calculation with static geostrophy. Center: Without any geostrophic calculations.
Right: With dynamic geostrophy. For further explanations see text.
i
I.
Jg
8.
I
~
~
~
[
eo.
f
.....
o
v.