

698
0
-2
c::
'> Q5 -4
~
-6
-8
0
c::
'> -1
~
-2
0.0
0
200
0
400
Herterich et al.
mixed layer temperature
600
800
years
1000
1200
temperature (2000m depth)
600
./ ..... _800
1000
years
1200
salinity (2000m depth)
~ .. -::.~.~._.~ .. _/_.c.=----.--.-----o
200
400
600
800
1000
years
1200
1400
1600
/ ' -
1400
1600
1400
1600
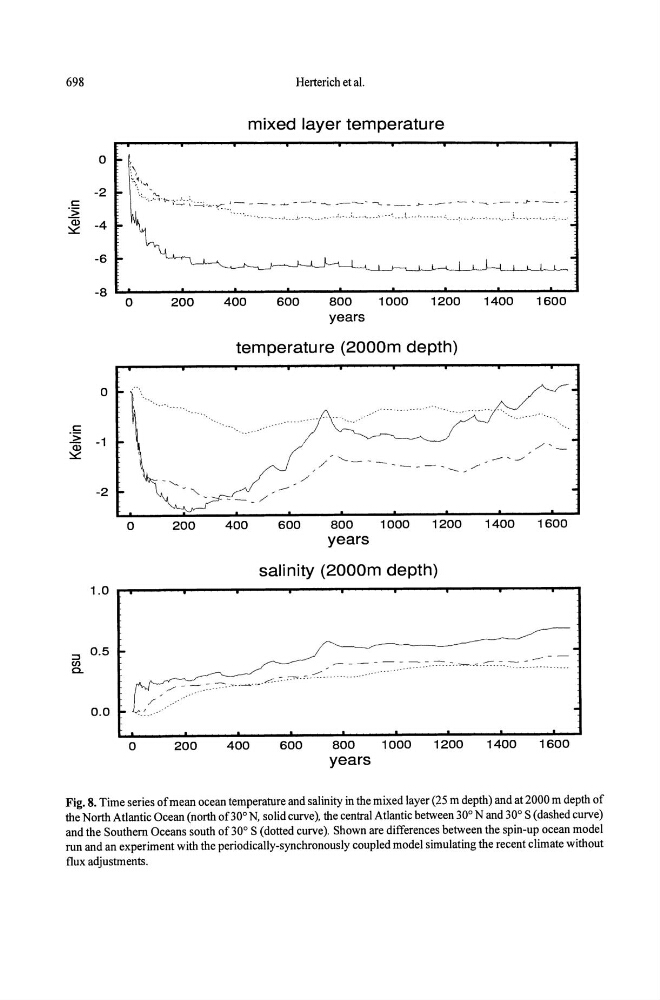
Fig. 8. Time series of mean ocean temperature and salinity in the mixed layer (25 m depth) and at 2000 m depth of
the North Atlantic Ocean (north of30° N, solid curve), the central Atlantic between 30° Nand 30° S (dashed curve)
and the Southern Oceans south of 30° S (dotted curve). Shown are differences between the spin-up ocean model
run and an experiment with the periodically-synchronously coupled model simulating the recent climate without
flux adjustments.
0
-2
c::
'> Q5 -4
~
-6
-8
0
c::
'> -1
~
-2
0.0
0
200
0
400
Herterich et al.
mixed layer temperature
600
800
years
1000
1200
temperature (2000m depth)
600
./ ..... _800
1000
years
1200
salinity (2000m depth)
~ .. -::.~.~._.~ .. _/_.c.=----.--.-----o
200
400
600
800
1000
years
1200
1400
1600
/ ' -
1400
1600
1400
1600
Fig. 8. Time series of mean ocean temperature and salinity in the mixed layer (25 m depth) and at 2000 m depth of
the North Atlantic Ocean (north of30° N, solid curve), the central Atlantic between 30° Nand 30° S (dashed curve)
and the Southern Oceans south of 30° S (dotted curve). Shown are differences between the spin-up ocean model
run and an experiment with the periodically-synchronously coupled model simulating the recent climate without
flux adjustments.