

666
Paul eta!.
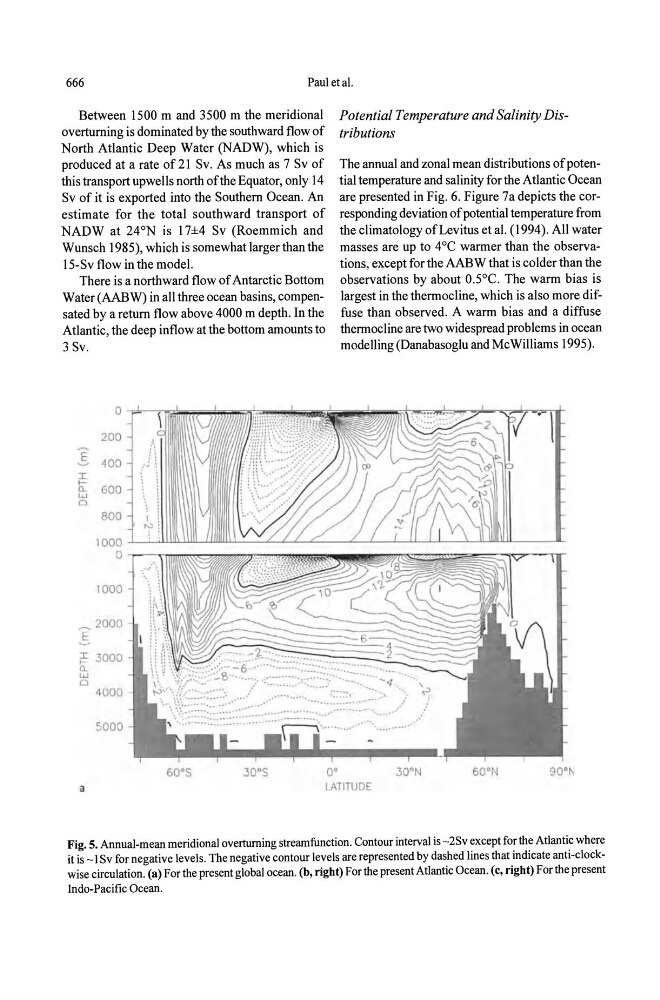
Between 1500 m and 3500 m the meridional
overturning is dominated by the southward flow of
North Atlantic Deep Water (NADW), which is
produced at a rate of 21 Sv. As much as 7 Sv of
this transport upwells north of the Equator, only 14
Sv of it is exported into the Southern Ocean. An
estimate for the total southward transport of
NADW at 24°N is 17±4 Sv (Roemmich and
Wunsch 1985), which is somewhat larger than the
15-Sv flow in the model.
There is a northward flow of Antarctic Bottom
Water (AABW) in all three ocean basins, compensated by a return flow above 4000 m depth. In the
Atlantic, the deep inflow at the bottom amounts to
3 Sv.
Potential Temperature and Salinity Distributions
The annual and zonal mean distributions of potential temperature and salinity for the Atlantic Ocean
are presented in Fig. 6. Figure 7a depicts the corresponding deviation of potential temperature from
the climatology ofLevitus et al. (1994). All water
masses are up to 4°C warmer than the observations, except for the AABW that is colder than the
observations by about 0.5°C. The warm bias is
largest in the thermocline, which is also more diffuse than observed. A warm bias and a diffuse
thermocline are two widespread problems in ocean
modelling (Danabasoglu and McWilliams 1995).
o Y~rJI1!!J;I.
200 ~ .,
:c
I~
600
o
800
1000~~~Llli~~~--~~L-~--~~--L-ll-~--~~~L---~L
0 -,-- ."","""" ...... ....,
1000
~ 2000
..s
~ 3000
0..
w
o
5000
a
60·5
30·S
o·
LATITUDE
60·N
90·N
Fig. 5. Annual-mean meridional overturning streamfunction. Contour interval is -2Sv except for the Atlantic where
it is -\ Sv for negative levels. The negative contour levels are represented by dashed lines that indicate anti-clockwise circulation. (a) For the present global ocean. (b, right) For the present Atlantic Ocean. (c, right) For the present
Indo-Pacific Ocean.