

604
von Dobeneck and Schmieder
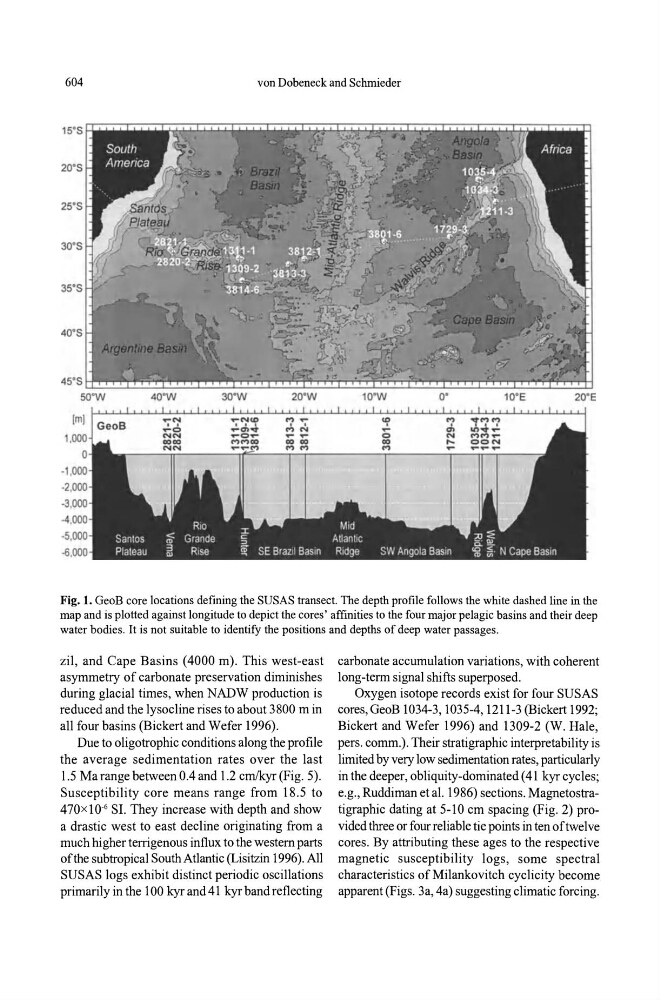
Fig. 1. GeoB core locations defining the SUSAS transect. The depth profile follows the white dashed line in the
map and is plotted against longitude to depict the cores' affinities to the four major pelagic basins and their deep
water bodies. It is not suitable to identify the positions and depths of deep water passages.
zil, and Cape Basins (4000 m). This west-east
asymmetry of carbonate preservation diminishes
during glacial times, when NADW production is
reduced and the lysocline rises to about 3800 min
all four basins (Bickert and Wefer 1996).
Due to oligotrophic conditions along the profile
the average sedimentation rates over the last
1.5 Ma range between 0.4 and 1.2 cmlkyr (Fig. 5).
Susceptibility core means range from 18 .5 to
470x 10. 6 SI. They increase with depth and show
a drastic west to east decline originating from a
much higher terrigenous influx to the western parts
of the subtropical South Atlantic (Lisitzin 1996). All
SUSAS logs exhibit distinct periodic oscillations
primarily in the 100 kyr and 41 kyr band reflecting
carbonate accumulation variations, with coherent
long-term signal shifts superposed.
Oxygen isotope records exist for four SUSAS
cores, GeoB 1034-3, 1035-4, 1211-3 (Bickert 1992;
Bickert and Wefer 1996) and 1309-2 (W. Hale,
pers. comm.). Their stratigraphic interpretability is
limited by very low sedimentation rates, particularly
in the deeper, obliquity-dominated (41 kyr cycles;
e.g., Ruddiman et al. 1986) sections. Magnetostratigraphic dating at 5-10 cm spacing (Fig. 2) provided three or four reliable tie points in ten of twelve
cores. By attributing these ages to the respective
magnetic susceptibility logs, some spectral
characteristics of Milankovitch cyclicity become
apparent (Figs. 3a, 4a) suggesting climatic forcing.