

The Magnetic View on the Marine Paleoenvironment
591
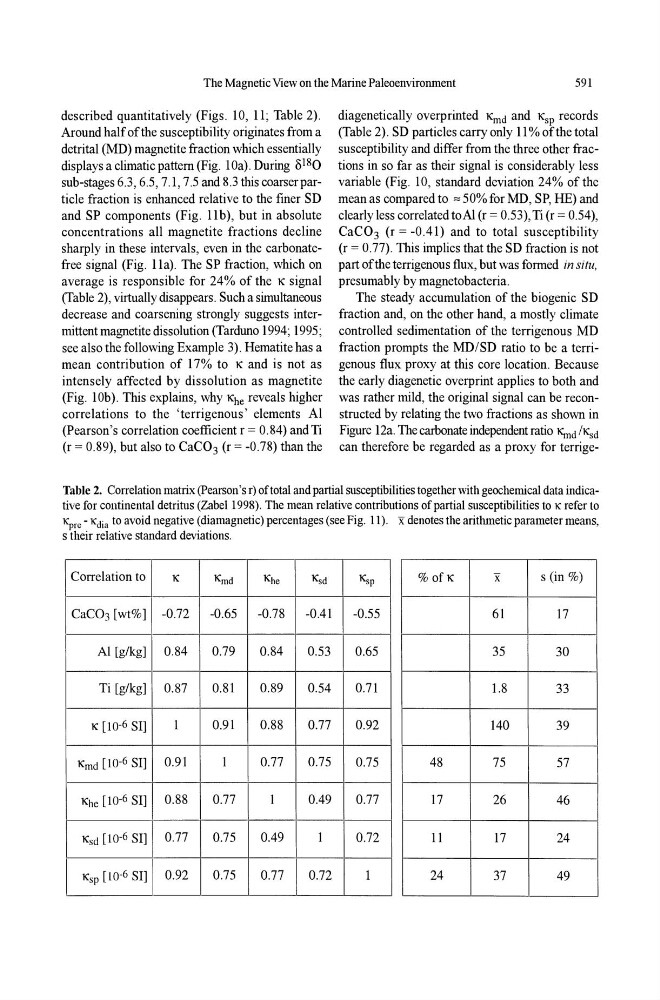
described quantitatively (Figs. 10, 11; Table 2).
Around half of the susceptibility originates from a
detrital (MD) magnetite fraction which essentially
displays a climatic pattern (Fig. lOa). During 0 18 0
sub-stages 6.3, 6.5, 7.1, 7.5 and 8.3 this coarser particle fraction is enhanced relative to the finer SD
and SP components (Fig. lIb), but in absolute
concentrations all magnetite fractions decline
sharply in these intervals, even in the carbonatefree signal (Fig. 11a). The SP fraction, which on
average is responsible for 24% ofthe K signal
(Table 2), virtually disappears. Such a simultaneous
decrease and coarsening strongly suggests intermittentmagnetite dissolution (Tarduno 1994; 1995;
see also the following Example 3). Hematite has a
mean contribution of 17% to K and is not as
intensely affected by dissolution as magnetite
(Fig. lOb). This explains, why Khe reveals higher
correlations to the 'terrigenous' elements Al
(Pearson's correlation coefficient r = 0.84) and Ti
(r = 0.89), but also to CaC0 3 (r = -0.78) than the
diagenetically overprinted Kmd and Ks p records
(Table 2). SD particles carry only II % of the total
susceptibility and differ from the three other fractions in so far as their signal is considerably less
variable (Fig. 10, standard deviation 24% ofthe
mean as compared to '" 50% for MD, SP, HE) and
clearly less correlated toAl (r = 0.53), Ti (r = 0.54),
CaC0 3 (r = -0.41) and to total susceptibility
(r = 0.77). This implies that the SD fraction is not
part of the terrigenous flux, but was formed in situ,
presumably by magnetobacteria.
The steady accumulation of the biogenic SD
fraction and, on the other hand, a mostly climate
controlled sedimentation of the terrigenous MD
fraction prompts the MD/SD ratio to be a terrigenous flux proxy at this core location. Because
the early diagenetic overprint applies to both and
was rather mild, the original signal can be reconstructed by relating the two fractions as shown in
Figure 12a. The carbonate independent ratio Kmd IKsd
can therefore be regarded as a proxy for terrigeTable 2. Correlation matrix (pearson's r) oftotal and partial susceptibilities together with geochemical data indicative for continental detritus (Zabel 1998). The mean relative contributions of partial susceptibilities to K refer to
xpre - Kdia to avoid negative (diamagnetic) percentages (see Fig. 11). x denotes the arithmetic parameter means,
s their relative standard deviations.
Correlation to
K
Kmd
Khe
Ksd
Ksp
% ofK
x
s (in %)
CaC03 [wt%] -0.72 -0.65
-0.78
-0.41
-0.55
61
17
Al [g/kg] 0.84
0.79
0.84
0.53
0.65
35
30
Ti [g/kg] 0.87
0.81
0.89
0.54
0.71
1.8
33
K [10-6 SI]
1
0.91
0.88
0.77
0.92
140
39
Kmd [10-6 SI] 0.91
1
0.77
0.75
0.75
48
75
57
Khe [10-6 SI] 0.88
0.77
1
0.49
0.77
17
26
46
Ksd [10-6 SI] 0.77
0.75
0.49
1
0.72
11
17
24
Ksp [10-6 SI] 0.92
0.75
0.77
0.72
1
24
37
49