

586
Frederichs et al.
data co-linearity, imparted by the limited potential
of individual parameters to discriminate particular
components, is to some extent reduced by forming
interparametric differences (~ linear parameters). The influence of matrix constituents can be
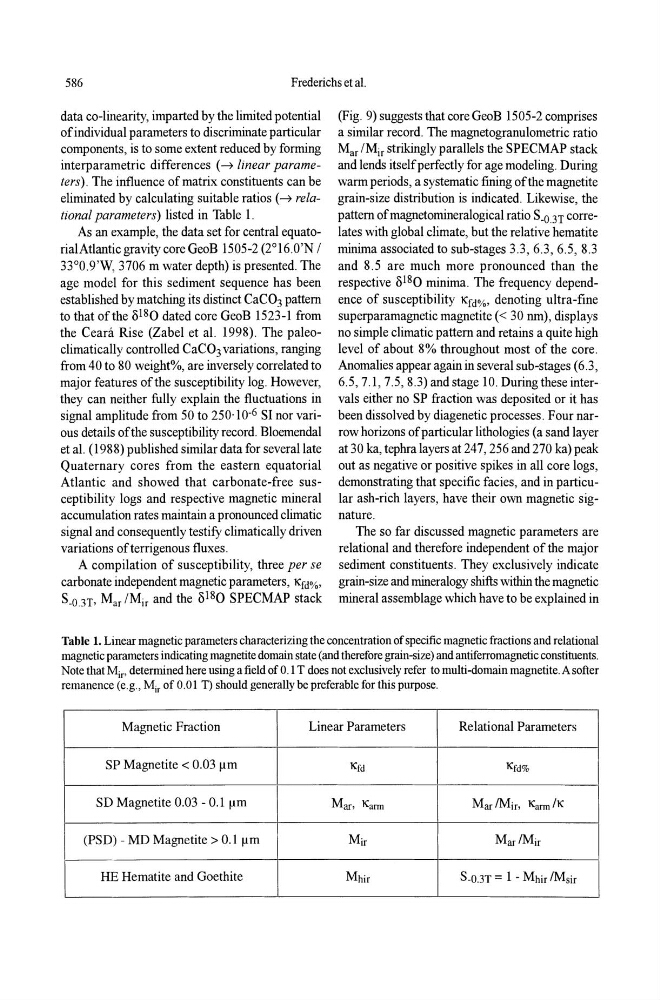
eliminated by calculating suitable ratios (~ relational parameters) listed in Table l.
As an example, the data set for central equatorial Atlantic gravity core GeoB 1505-2 (2°16.0'N I
33°0.9'W, 3706 m water depth) is presented. The
age model for this sediment sequence has been
established by matching its distinct CaC0 3 pattern
to that of the 0 18 0 dated core GeoB 1523-1 from
the Ceara Rise (Zabel et al. 1998). The paleoclimatically controlled CaC0 3 variations, ranging
from 40 to 80 weight%, are inversely correlated to
major features of the susceptibility log. However,
they can neither fully explain the fluctuations in
signal amplitude from 50 to 250.10- 6 SI nor various details of the susceptibility record. Bloemendal
et al. (1988) published similar data for several late
Quaternary cores from the eastern equatorial
Atlantic and showed that carbonate-free susceptibility logs and respective magnetic mineral
accumulation rates maintain a pronounced climatic
signal and consequently testify climatically driven
variations of terrigenous fluxes.
A compilation of susceptibility, three per se
carbonate independent magnetic parameters, Kfd%,
S_O.3T, Mar IMjr and the 0 18 0 SPECMAP stack
(Fig. 9) suggests that core GeoB 1505-2 comprises
a similar record. The magnetogranulometric ratio
Mar IMjr strikiogly parallels the SPECMAP stack
and lends itself perfectly for age modeling. During
warm periods, a systematic fining of the magnetite
grain-size distribution is indicated. Likewise, the
pattern of magnetomineralogical ratio S-O.3T correlates with global climate, but the relative hematite
minima associated to sub-stages 3.3, 6.3, 6.5, 8.3
and 8.5 are much more pronounced than the
respective 0 18 0 minima. The frequency dependence of susceptibility Kfd%, denoting ultra-fine
superparamagnetic magnetite « 30 nm), displays
no simple climatic pattern and retains a quite high
level of about 8% throughout most of the core.
Anomalies appear again in several sub-stages (6.3,
6.5,7.1,7.5,8.3) and stage 10. During these intervals either no SP fraction was deposited or it has
been dissolved by diagenetic processes. Four narrow horizons of particular lithologies (a sand layer
at 30 ka, tephra layers at 247, 256 and 270 ka) peak
out as negative or positive spikes in all core logs,
demonstrating that specific facies, and in particular ash-rich layers, have their own magnetic signature.
The so far discussed magnetic parameters are
relational and therefore independent of the major
sediment constituents. They exclusively indicate
grain-size and mineralogy shifts within the magnetic
mineral assemblage which have to be explained in
Table 1. Linear magnetic parameters characterizing the concentration of specific magnetic fractions and relational
magnetic parameters indicating magnetite domain state (and therefore grain-size) and antiferromagnetic constituents.
Note that 1\r' determined here using a field of 0.1 T does not exclusively refer to multi-domain magnetite. A softer
remanence (e.g., 1\r of 0.0 I T) should generally be preferable for this purpose.
Magnetic Fraction
Linear Parameters
Relational Parameters
SP Magnetite < 0.03 ~m
Kfd
Kfd%
SD Magnetite 0.03 - 0.1 ~m
Mar, Kann
Mar !Mir, Kann tK
(PSD) - MD Magnetite> 0.1 ~m
Mir
Mar!Mir
HE Hematite and Goethite
Mhir
S-0.3T = 1 - Mhir 1Msir