

584
Frederichs et al.
paraIII
•
magnetic matrix
S_0.3T
more
less
.. hematite·
Be [mT]
less
more
III
•
stable magnetite
less
more
..
.
stable fine magnetite
coarser
finer
III
•
magnetite
less
more
III
•
fine magnetite
less
more
III
•
ultra-fine magnetite
-s
+s
S
0.00
0.05
0.10
0.15
0.20
0.2
0.30
0.35
-0.3T 0 .93
0.94
0.95
0.96
0.7
0.98
Be [mT]
10
11
1
13
14
15
16
20
22
24
26
28
3
32
34
0.18
0.20
0.22
0.24
0.26
028
0.30
0.32
.05
0.06
D.07
0.08
.09
0.10
-5
0
5
10
15
0
25
30
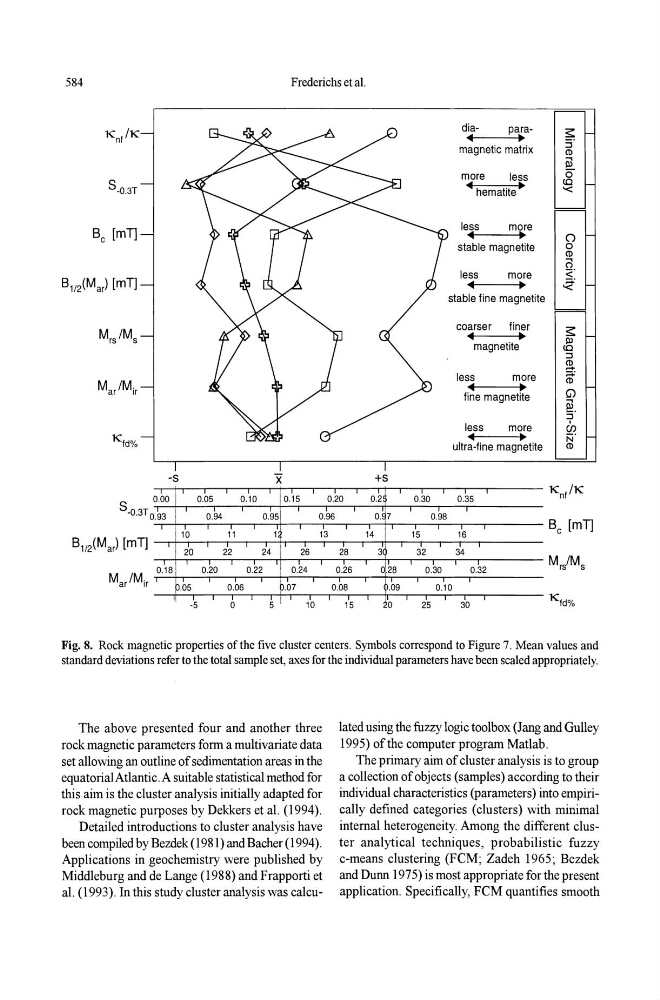
Fig_ 8. Rock magnetic properties of the five cluster centers. Symbols correspond to Figure 7. Mean values and
standard deviations refer to the total sample set, axes for the individual parameters have been scaled appropriately.
The above presented four and another three
rock magnetic parameters fonn a multivariate data
set allowing an outline of sedimentation areas in the
equatorial Atlantic. A suitable statistical method for
this aim is the cluster analysis initially adapted for
rock magnetic purposes by Dekkers et al. (1994).
Detailed introductions to cluster analysis have
been compiled by Bezdek (1981) and Bacher (1994).
Applications in geochemistry were published by
Middleburg and de Lange (1988) and Frapporti et
al. (1993). In this study cluster analysis was calculated using the fuzzy logic toolbox (Jang and Gulley
1995) of the computer program Matlab.
The primary aim of cluster analysis is to group
a collection of objects (samples) according to their
individual characteristics (parameters) into empirically defmed categories (clusters) with minimal
internal heterogeneity. Among the different cluster analytical techniques, probabilistic fuzzy
c-means clustering (FCM; Zadeh 1965; Bezdek
and Dunn 1975) is most appropriate for the present
application. Specifically, FCM quantifies smooth