

560
Wagner and Dupont
15
"" ..
10
:1...., .. 01
~ ,:
.. 1. 101
iiJ, II~. ' IHU
tI ~ .. IID~.
IIllt
III ~ .
II
111' • lIi"ui,' ItIJllU itO!'!
1I;;1I11 '1;;~
10 "----...:.:~
15
10
10 1
30
/
25
20
15
10
Lon~lludc
A
B
o
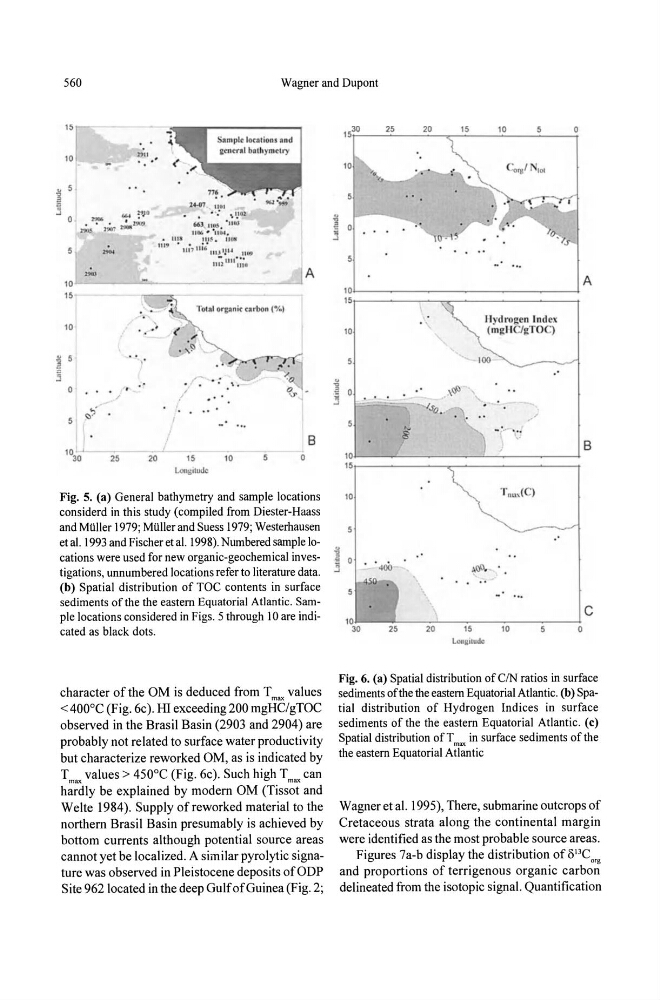
Fig. 5. (a) General bathymetry and sample locations
considerd in this study (compiled from Diester-Haass
and MUller 1979; MUller and Suess 1979; Westerhausen
et al. 1993 and Fischer et al. 1998). Numbered sample locations were used for new organic-geochemical investigations, unnumbered locations refer to literature data.
(b) Spatial distribution of TOC contents in surface
sediments of the the eastern Equatorial Atlantic. Sample locations considered in Figs. 5 through 10 are indicated as black dots.
character of the OM is deduced from T values
max
< 400°C (Fig. 6c). HI exceeding 200 mgHC/gTOC
observed in the Brasil Basin (2903 and 2904) are
probably not related to surface water productivity
but characterize reworked OM, as is indicated by
T max values > 450°C (Fig. 6c). Such high T max can
hardly be explained by modern OM (Tissot and
Welte 1984). Supply of reworked material to the
northern Brasil Basin presumably is achieved by
bottom currents although potential source areas
cannot yet be localized. A similar pyrolytic signature was observed in Pleistocene deposits ofODP
Site 962 located in the deep Gulf of Guinea (Fig. 2;
25
20
15
10
5
10
10' ~-_ _ - - - -______________________ 4
15r---------.-"'("'C-------------...,
10
\tf>
..fa .
lIyclrogen Index
(mgHC/gTOq
100
10'~--_
_ ~-- ________ _L ____________ 4
15 r------------,~----------------~
10
20
15
lOrlKllude
10
o
A
B
c
Fig. 6. (a) Spatial distribution ofCIN ratios in surface
sediments of the the eastern Equatorial Atlantic. (b) Spa·
tial distribution of Hydrogen Indices in surface
sediments of the the eastern Equatorial Atlantic. (c)
Spatial distribution of T max in surface sediments of the
the eastern Equatorial Atlantic
Wagner et al. 1995), There, submarine outcrops of
Cretaceous strata along the continental margin
were identified as the most probable source areas.
Figures 7a-b display the distribution of o l3C o ,.
and proportions of terrigenous organic carbon
delineated from the isotopic signal. Quantification