

Reconstruction of Surface Ocean Nitrate Utilization
453
the northwest and the BCC continues northward
at the surface along the coast until it meets the AC
at the ABF (Meeuwis and Lutjeharms 1990). At
the present time, the ABF shifts seasonally between 15°S and 17°S. The BCC continues to flow
north of the ABF as a shallow subsurface current
to between 5 0 S and 10 0 S (Hagen et al. 1981; Van
Bennekom and Berger 1984).
Upwelling of nutrient-rich water causes the
waters of the Benguela system to be highly productive (Van Bennekom and Berger 1984; Shannon et al. 1987; Berger 1989). Around the Zaire
River mouth, seasonal nearshore upwelling occurs
due to the piling up of the eastward flowing Equatorial Undercurrent (EUC) at the continental margin off Zaire and Gabun (Servain et al. 1982;
Voituriez and Herbland 1982; Van Bennekom and
Berger 1984). Zaire River runoff adds to the nutrient content of Angola Basin waters. South of the
ABF, strong southeast trade winds cause the
shoaling of the thermoclines and nutriclines to within
or just below the euphotic zone during austral winter (Voituriez and Herbland 1981; Hastenrath and
Merle 1987) when cold nutrient-rich water from
10
.' ,
400
"2 8
·iii
en
~ 6
...... 300
0
)("'7
~
-=~
z
u-""O
~4
_ N
200
.l!l E
I
o 0)
1-5 100
2
0
0
Sample
Month
Season
around 200 m depth is brought to the surface
(Calvert and Price 1971; Jones 1971). Coastal
upwelling extends seaward about 150-200 km, but
upwelling filaments have been observed as far offshore as 1000 km (Lutjeharms and Stockton 1987;
Lutjeharms et al. 1991).
Results and Discussion
Sinking Particles at the Walvis Ridge
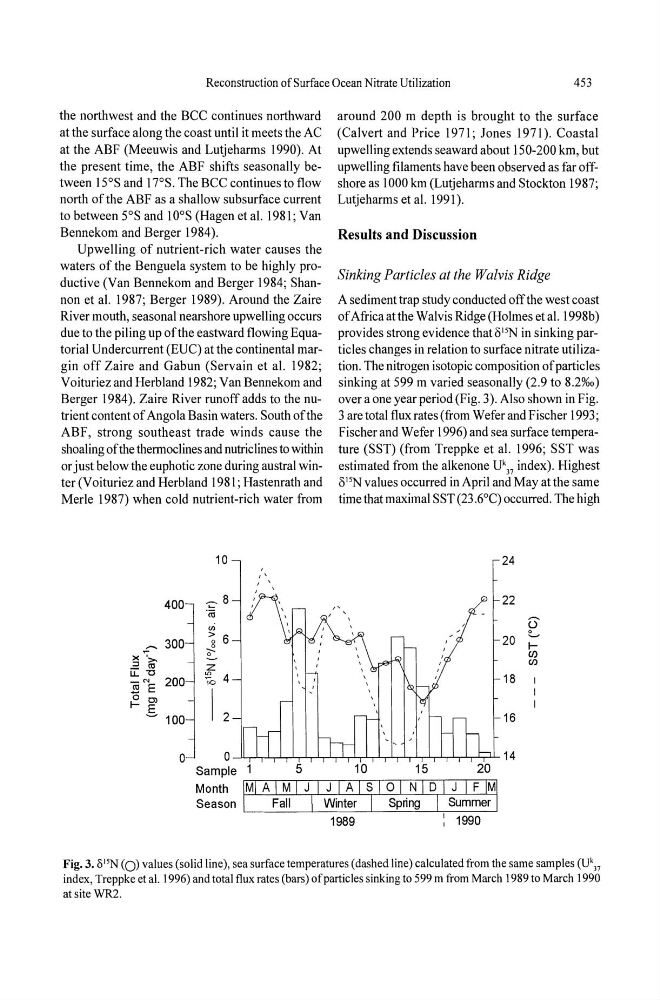
A sediment trap study conducted off the west coast
of Africa at the Walvis Ridge (Holmes et al. 1998b)
provides strong evidence that 1)15N in sinking particles changes in relation to surface nitrate utilization. The nitrogen isotopic composition of particles
sinking at 599 m varied seasonally (2.9 to 8.2%0)
over a one year period (Fig. 3). Also shown in Fig.
3 are total flux rates (from Wefer and Fischer 1993;
Fischer and Wefer 1996) and sea surface temperature (SST) (from Treppke et al. 1996; SST was
estimated from the alkenone Uk 37 index). Highest
1)lSN values occurred in April and May at the same
time that maximal SST (23 .6°C) occurred. The high
24
22
E
20 Ien
en
18
16
14
20
Fig. 3. /)l~ (0) values (solid line), sea surface temperatures (dashed line) calculated from the same samples (U\7
index, Treppke eta!. 1996) and total t1uxrates (bars) of particles sinking to 599 m from March 1989 to March 1990
at site WR2.
453
the northwest and the BCC continues northward
at the surface along the coast until it meets the AC
at the ABF (Meeuwis and Lutjeharms 1990). At
the present time, the ABF shifts seasonally between 15°S and 17°S. The BCC continues to flow
north of the ABF as a shallow subsurface current
to between 5 0 S and 10 0 S (Hagen et al. 1981; Van
Bennekom and Berger 1984).
Upwelling of nutrient-rich water causes the
waters of the Benguela system to be highly productive (Van Bennekom and Berger 1984; Shannon et al. 1987; Berger 1989). Around the Zaire
River mouth, seasonal nearshore upwelling occurs
due to the piling up of the eastward flowing Equatorial Undercurrent (EUC) at the continental margin off Zaire and Gabun (Servain et al. 1982;
Voituriez and Herbland 1982; Van Bennekom and
Berger 1984). Zaire River runoff adds to the nutrient content of Angola Basin waters. South of the
ABF, strong southeast trade winds cause the
shoaling of the thermoclines and nutriclines to within
or just below the euphotic zone during austral winter (Voituriez and Herbland 1981; Hastenrath and
Merle 1987) when cold nutrient-rich water from
10
.' ,
400
"2 8
·iii
en
~ 6
...... 300
0
)("'7
~
-=~
z
u-""O
~4
_ N
200
.l!l E
I
o 0)
1-5 100
2
0
0
Sample
Month
Season
around 200 m depth is brought to the surface
(Calvert and Price 1971; Jones 1971). Coastal
upwelling extends seaward about 150-200 km, but
upwelling filaments have been observed as far offshore as 1000 km (Lutjeharms and Stockton 1987;
Lutjeharms et al. 1991).
Results and Discussion
Sinking Particles at the Walvis Ridge
A sediment trap study conducted off the west coast
of Africa at the Walvis Ridge (Holmes et al. 1998b)
provides strong evidence that 1)15N in sinking particles changes in relation to surface nitrate utilization. The nitrogen isotopic composition of particles
sinking at 599 m varied seasonally (2.9 to 8.2%0)
over a one year period (Fig. 3). Also shown in Fig.
3 are total flux rates (from Wefer and Fischer 1993;
Fischer and Wefer 1996) and sea surface temperature (SST) (from Treppke et al. 1996; SST was
estimated from the alkenone Uk 37 index). Highest
1)lSN values occurred in April and May at the same
time that maximal SST (23 .6°C) occurred. The high
24
22
E
20 Ien
en
18
16
14
20
Fig. 3. /)l~ (0) values (solid line), sea surface temperatures (dashed line) calculated from the same samples (U\7
index, Treppke eta!. 1996) and total t1uxrates (bars) of particles sinking to 599 m from March 1989 to March 1990
at site WR2.