

Variability in Export Production Documented by Downward Fluxes and Species Composition
379
1998; Treppke eta!' 1996a, b; Romero eta!. subm).
The interpretation ofthese siliceous remains in the
water column and sediments raises the problem of
identifying their source areas and transporting
agents. In nearshore areas, transport by rivers
cannot be neglected as a possible mechanism of
deposition (e.g. Guinea Basin and Congo fan, Melia
1984; van Iperen et al. 1987; Gasse et al. 1989).
However, freshwater diatoms and phytoliths from
midocean sites, like the ones presented here, are
most likely windblown.
Windblown diatoms mainly originate from deflation basins and Holocene lake sediments dispersed throughout the Sahara and the Sahel, and
from river supplies in the Chad basin (e.g.
Tamanrasset area in central and northern Sahara,
alluvial plains ofBilma, Niger and Faya Largeau
in the Chad Basin at the southern edge ofthe SaMooring sites
Lithogenics
(mgm"d-')
Eastern Tropical Atlantic
CEI
79.93 ± 32.34
CVI-2
60.24 ± 27.21
Eastern Equatorial Atlantic
EAl
28.51 ± 16.65
EA2
24.12 ± 18.42
EA3
6.30 ± 5.49
EA4
4.10±5.54
EAS
6.42 ± 9.34
Western Equatorial Atlantic
WA7
4.10 ± 2.89
WA3
2.39 ± 3.01
hara; Fig. 7). Phytoliths are discrete, solid bodies
of opaline silica in epidermal cells of grasses
(Blackman 1971). They are injected into the atmosphere during dry-season brush fires (e.g. Folger et
al. 1967; Pokras and Mix 1985). Grasses are dominant in the Tenere and in the Sahel, and in the transition zone between the northern edge of the Sahara and the southern boundary ofthe Mediterranean steppe (Anhufand Frankenberg 1991; Fig. 7).
It is assumed that the combined record of wind -
blown freshwater diatoms and phytoliths in the
deep-sea sediments away from the coast may reflect (a) phases of enhanced deflation and wind
transport, and therefore of aridity (e.g. Bukry 1980;
Pokras and Mix 1985; De Menocal et al. 1993) and
(b) changes in the position of the grass belt (driven
by rainfall) and wind directions (Pokras and Mix
1985).
Mean daily fluxes
Freshwater diatoms
Phytoliths
(valves * Ill' m-' d-')
(bodies * 10' m-' d-' )
3.06 ± 1.25
72.89 ± 34.52
9.17 ± 6.93
201.40 ± 129.87
3.70 ± 2.25
86.38 ± 62.75
4.55 ± 4.12
67.73 ± 51.29
1.83 ± 2.29
5.85 ± 10.79
0.44 ± 0.65
0.60 ± 0.85
0.42 ± 0.51
2.86 ± 6.12
0.70 ± 0.94
5.24 ± 2.67
0.15±0.18
0.08 ± 0.23
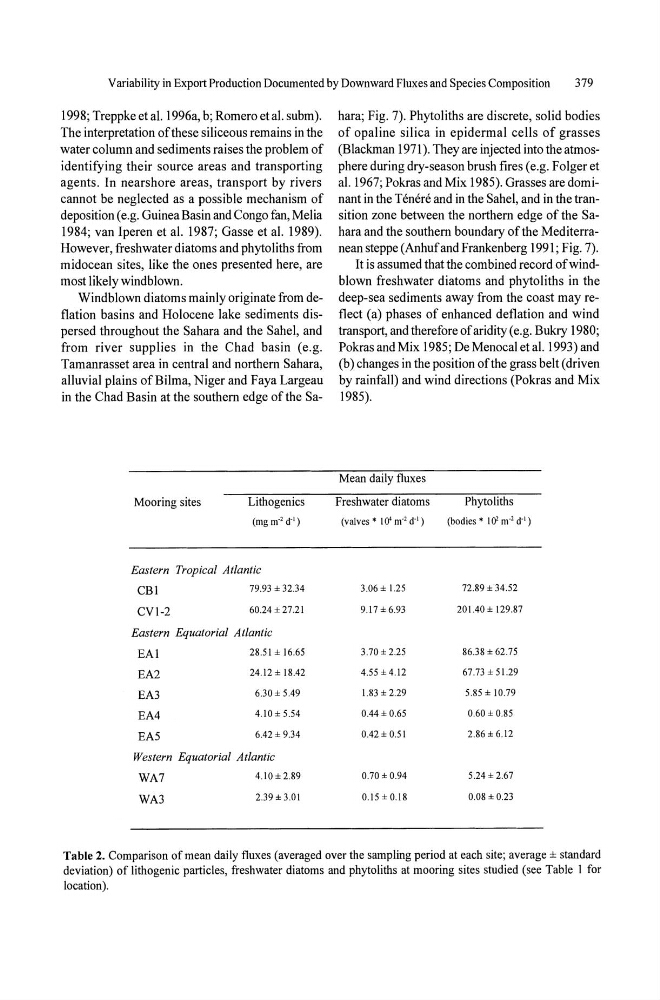
Table 2. Comparison of mean daily fluxes (averaged over the sampling period at each site; average ± standard
deviation) of lithogenic particles, freshwater diatoms and phytoliths at mooring sites studied (see Table I for
location).
379
1998; Treppke eta!' 1996a, b; Romero eta!. subm).
The interpretation ofthese siliceous remains in the
water column and sediments raises the problem of
identifying their source areas and transporting
agents. In nearshore areas, transport by rivers
cannot be neglected as a possible mechanism of
deposition (e.g. Guinea Basin and Congo fan, Melia
1984; van Iperen et al. 1987; Gasse et al. 1989).
However, freshwater diatoms and phytoliths from
midocean sites, like the ones presented here, are
most likely windblown.
Windblown diatoms mainly originate from deflation basins and Holocene lake sediments dispersed throughout the Sahara and the Sahel, and
from river supplies in the Chad basin (e.g.
Tamanrasset area in central and northern Sahara,
alluvial plains ofBilma, Niger and Faya Largeau
in the Chad Basin at the southern edge ofthe SaMooring sites
Lithogenics
(mgm"d-')
Eastern Tropical Atlantic
CEI
79.93 ± 32.34
CVI-2
60.24 ± 27.21
Eastern Equatorial Atlantic
EAl
28.51 ± 16.65
EA2
24.12 ± 18.42
EA3
6.30 ± 5.49
EA4
4.10±5.54
EAS
6.42 ± 9.34
Western Equatorial Atlantic
WA7
4.10 ± 2.89
WA3
2.39 ± 3.01
hara; Fig. 7). Phytoliths are discrete, solid bodies
of opaline silica in epidermal cells of grasses
(Blackman 1971). They are injected into the atmosphere during dry-season brush fires (e.g. Folger et
al. 1967; Pokras and Mix 1985). Grasses are dominant in the Tenere and in the Sahel, and in the transition zone between the northern edge of the Sahara and the southern boundary ofthe Mediterranean steppe (Anhufand Frankenberg 1991; Fig. 7).
It is assumed that the combined record of wind -
blown freshwater diatoms and phytoliths in the
deep-sea sediments away from the coast may reflect (a) phases of enhanced deflation and wind
transport, and therefore of aridity (e.g. Bukry 1980;
Pokras and Mix 1985; De Menocal et al. 1993) and
(b) changes in the position of the grass belt (driven
by rainfall) and wind directions (Pokras and Mix
1985).
Mean daily fluxes
Freshwater diatoms
Phytoliths
(valves * Ill' m-' d-')
(bodies * 10' m-' d-' )
3.06 ± 1.25
72.89 ± 34.52
9.17 ± 6.93
201.40 ± 129.87
3.70 ± 2.25
86.38 ± 62.75
4.55 ± 4.12
67.73 ± 51.29
1.83 ± 2.29
5.85 ± 10.79
0.44 ± 0.65
0.60 ± 0.85
0.42 ± 0.51
2.86 ± 6.12
0.70 ± 0.94
5.24 ± 2.67
0.15±0.18
0.08 ± 0.23
Table 2. Comparison of mean daily fluxes (averaged over the sampling period at each site; average ± standard
deviation) of lithogenic particles, freshwater diatoms and phytoliths at mooring sites studied (see Table I for
location).