

Variability in Export Production Documented by Downward Fluxes and Species Composition
377
Western Equatorial Atlantic
Total particle, opal and diatom fluxes calculated on
a daily basis were lower in the western equatorial
Atlantic than in the eastern equatorial Atlantic,
particularly at the southern site W A3 (Fig. 5), as
may be expected from satellite data (Longhurst
1993). Fluxes paralleled each other. No distinct
temporal pattern was observed during the sampling
period with the exception of a slight increase in the
diatom flux in early fall at 7 0 S (site WA3; Fig. 5).
As was the case in the eastern equatorial area, N.
bicapitata dominated the assemblage, and was
accompanied by other warm-water, oceanic species such as N. interruptestriata, N. sp. cf. sicula,
N. capuluspalae and Azpeitia spp. (Plate J).
During times of diatom flux maximaN. bicapitata
contributed more than 40% to the total diatom assemblage.
Walvis Ridge
Trap site WR2 was positioned about 200 nautical
miles offshore the west coast of Namibia within the
Benguela Current system. The site is influenced by
upwelling filaments streaming offshore characteristic of the Namibian coast (e.g. Shannon and
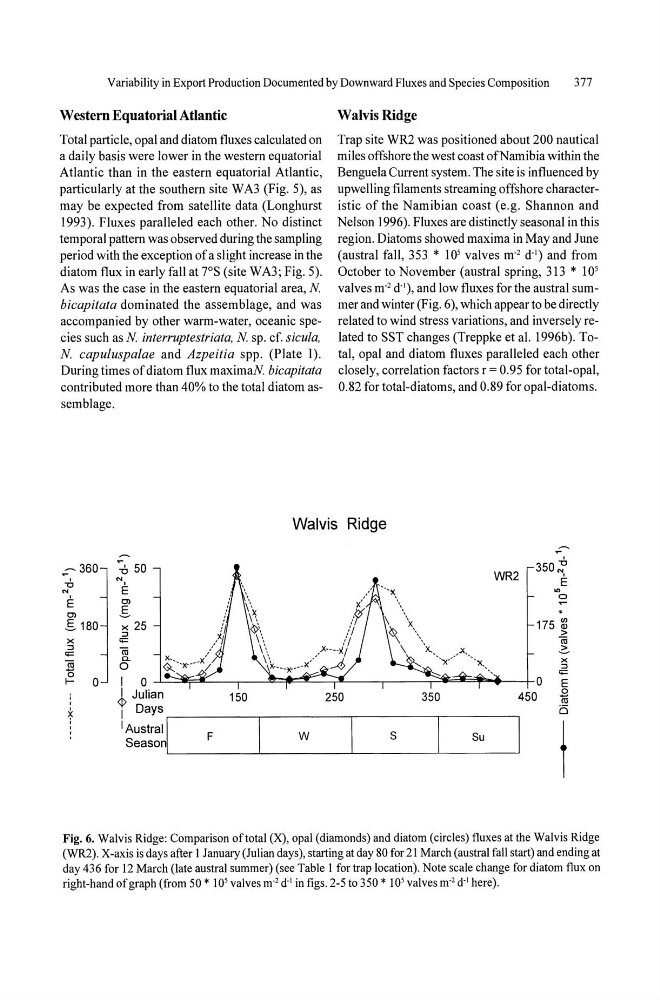
Nelson 1996). Fluxes are distinctly seasonal in this
region. Diatoms showed maxima in May and June
(austral fall, 353 * 10 5 valves m· 2 d· l ) and from
October to November (austral spring, 313 * 10 5
valves m· 2 d· l ), and low fluxes for the austral summer and winter (Fig. 6), which appear to be directly
related to wind stress variations, and inversely related to SST changes (Treppke et al. 1996b). Total, opal and diatom fluxes paralleled each other
closely, correlation factors r = 0.95 for total-opal,
0.82 for total-diatoms, and 0.89 for opal-diatoms.
Walvis Ridge
.;:-- 360
-6
'"
E
Ol
5180
><
:J
<0::
ro (5
f0
~
':0 50
'" E
Ol
5
>< 25
:J
<0::
ro 0.
0
WR2
'" o
175 :fl
>
ro
6
><
:J
I 0
<0::
~~~--~~~~~~--~--~~~~~~o
E
~ Julian
150
I Days
I Austral I
F
Season
250
W
350
S
Su
450
o
ro
is
j
Fig. 6. Walvis Ridge: Comparison of total (X), opal (diamonds) and diatom (circles) fluxes at the Walvis Ridge
(WR2). X-axis is days after 1 January (Julian days), starting at day 80 for 21 March (austral fall start) and ending at
day 436 for 12 March (late austral summer) (see Table 1 for trap location). Note scale change for diatom flux on
right-hand of graph (from 50 * 10' valves m" d· l in figs. 2-5 to 350 * lOS valves m" d· l here).
377
Western Equatorial Atlantic
Total particle, opal and diatom fluxes calculated on
a daily basis were lower in the western equatorial
Atlantic than in the eastern equatorial Atlantic,
particularly at the southern site W A3 (Fig. 5), as
may be expected from satellite data (Longhurst
1993). Fluxes paralleled each other. No distinct
temporal pattern was observed during the sampling
period with the exception of a slight increase in the
diatom flux in early fall at 7 0 S (site WA3; Fig. 5).
As was the case in the eastern equatorial area, N.
bicapitata dominated the assemblage, and was
accompanied by other warm-water, oceanic species such as N. interruptestriata, N. sp. cf. sicula,
N. capuluspalae and Azpeitia spp. (Plate J).
During times of diatom flux maximaN. bicapitata
contributed more than 40% to the total diatom assemblage.
Walvis Ridge
Trap site WR2 was positioned about 200 nautical
miles offshore the west coast of Namibia within the
Benguela Current system. The site is influenced by
upwelling filaments streaming offshore characteristic of the Namibian coast (e.g. Shannon and
Nelson 1996). Fluxes are distinctly seasonal in this
region. Diatoms showed maxima in May and June
(austral fall, 353 * 10 5 valves m· 2 d· l ) and from
October to November (austral spring, 313 * 10 5
valves m· 2 d· l ), and low fluxes for the austral summer and winter (Fig. 6), which appear to be directly
related to wind stress variations, and inversely related to SST changes (Treppke et al. 1996b). Total, opal and diatom fluxes paralleled each other
closely, correlation factors r = 0.95 for total-opal,
0.82 for total-diatoms, and 0.89 for opal-diatoms.
Walvis Ridge
.;:-- 360
-6
'"
E
Ol
5180
><
:J
<0::
ro (5
f0
~
':0 50
'" E
Ol
5
>< 25
:J
<0::
ro 0.
0
WR2
'" o
175 :fl
>
ro
6
><
:J
I 0
<0::
~~~--~~~~~~--~--~~~~~~o
E
~ Julian
150
I Days
I Austral I
F
Season
250
W
350
S
Su
450
o
ro
is
j
Fig. 6. Walvis Ridge: Comparison of total (X), opal (diamonds) and diatom (circles) fluxes at the Walvis Ridge
(WR2). X-axis is days after 1 January (Julian days), starting at day 80 for 21 March (austral fall start) and ending at
day 436 for 12 March (late austral summer) (see Table 1 for trap location). Note scale change for diatom flux on
right-hand of graph (from 50 * 10' valves m" d· l in figs. 2-5 to 350 * lOS valves m" d· l here).