

Organic Carbon and Carbonate as Paleoproductivity Proxies
317
N.
Nitrogen
Fixation
New
Allochthonous
Ammonia
Nitrate Nitrite
nuviaule
eoIoc
c::::> Phytoplankton
upweU",o d ,nusion
Nitrate
Production
Ammonia
DON
particulate. di ssolved
:>
Export
PON DON
Regenerated
Autochthonous
., .
Mesozoa
Protozoa
Bacteria
Formation of organic carbon: CO2 + HP - CHP + O2
Formation of carbonate:
Ca 2 ' + 2HCO~ - CaC03 + H20 + CO2
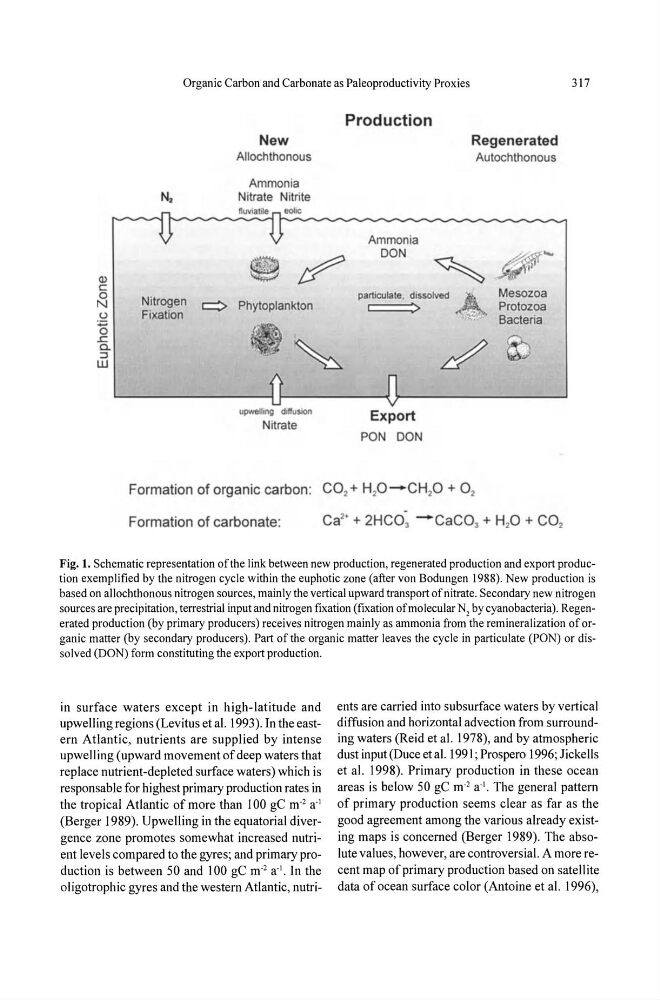
Fig. 1. Schematic representation of the link between new production, regenerated production and export production exemplified by the nitrogen cycle within the euphotic zone (after von Bodungen 1988). New production is
based on allochthonous nitrogen sources, mainly the vertical upward transport of nitrate. Secondary new nitrogen
sources are precipitation, terrestrial input and nitrogen fixation (fixation of molecular N, by cyanobacteria). Regenerated production (by primary producers) receives nitrogen mainly as ammonia from the remineralization of organic matter (by secondary producers). Part of the organic matter leaves the cycle in particulate (PON) or dissolved (DON) form constituting the export production.
in surface waters except in high-latitude and
upwelling regions (Levitus et al. 1993). In the eastern Atlantic, nutrients are supplied by intense
upwell ing (upward movement of deep waters that
replace nutrient-depleted surface waters) which is
responsable for highest primary production rates in
the tropical Atlantic of more than 100 gC m· 2 a· 1
(Berger 1989). Upwelling in the equatorial divergence zone promotes somewhat increased nutrient levels compared to the gyres; and primary production is between 50 and 100 gC m· 2 a· 1 • In the
oligotrophic gyres and the western Atlantic, nutrients are carried into subsurface waters by vertical
diffusion and horizontal advection from surrounding waters (Reid et al. 1978), and by atmospheric
dust input (Duce et al. 1991; Prospero 1996; Jickells
et al. 1998). Primary production in these ocean
areas is below 50 gC m· 2 a· 1 • The general pattern
of primary production seems clear as far as the
good agreement among the various already existing maps is concerned (Berger 1989). The absolute values, however, are controversial. A more recent map of primary production based on satellite
data of ocean surface color (Antoine et al. 1996),
317
N.
Nitrogen
Fixation
New
Allochthonous
Ammonia
Nitrate Nitrite
nuviaule
eoIoc
c::::> Phytoplankton
upweU",o d ,nusion
Nitrate
Production
Ammonia
DON
particulate. di ssolved
:>
Export
PON DON
Regenerated
Autochthonous
., .
Mesozoa
Protozoa
Bacteria
Formation of organic carbon: CO2 + HP - CHP + O2
Formation of carbonate:
Ca 2 ' + 2HCO~ - CaC03 + H20 + CO2
Fig. 1. Schematic representation of the link between new production, regenerated production and export production exemplified by the nitrogen cycle within the euphotic zone (after von Bodungen 1988). New production is
based on allochthonous nitrogen sources, mainly the vertical upward transport of nitrate. Secondary new nitrogen
sources are precipitation, terrestrial input and nitrogen fixation (fixation of molecular N, by cyanobacteria). Regenerated production (by primary producers) receives nitrogen mainly as ammonia from the remineralization of organic matter (by secondary producers). Part of the organic matter leaves the cycle in particulate (PON) or dissolved (DON) form constituting the export production.
in surface waters except in high-latitude and
upwelling regions (Levitus et al. 1993). In the eastern Atlantic, nutrients are supplied by intense
upwell ing (upward movement of deep waters that
replace nutrient-depleted surface waters) which is
responsable for highest primary production rates in
the tropical Atlantic of more than 100 gC m· 2 a· 1
(Berger 1989). Upwelling in the equatorial divergence zone promotes somewhat increased nutrient levels compared to the gyres; and primary production is between 50 and 100 gC m· 2 a· 1 • In the
oligotrophic gyres and the western Atlantic, nutrients are carried into subsurface waters by vertical
diffusion and horizontal advection from surrounding waters (Reid et al. 1978), and by atmospheric
dust input (Duce et al. 1991; Prospero 1996; Jickells
et al. 1998). Primary production in these ocean
areas is below 50 gC m· 2 a· 1 • The general pattern
of primary production seems clear as far as the
good agreement among the various already existing maps is concerned (Berger 1989). The absolute values, however, are controversial. A more recent map of primary production based on satellite
data of ocean surface color (Antoine et al. 1996),