

Kaolinite and Chlorite as Tracers of Modem and Late Quaternary Deep Water Circulation
297
periodograms of the kaolinite/chlorite-ratio, %kaolinite, and %-chlorite exhibit peaks in the in the
I OO-ka, 41-ka, and 23-ka periods, which, apart from
the 41-ka peak of %-chlorite, reach or exeed the
critical test levels, respectively (Fig. 8).
Cross spectral analyses between the three clay
mineral parameters and the reversed SPECMAP
8 18 0 record show that the variances of the clay
mineral parameters in the 100-ka" , 41-ka" and
23-ka" frequencies of eccentricity, obliquity, and
precession are highly coherent with the global ice
volume (Fig. 8, Table 2). The phase spectra reveal
that the maximal kaolinite/chlorite-ratio, maximal
%-kaolinite, and minimal %-chlorite are nearly in
phase with minima of global ice volume in the
100-ka" and 41-ka", and 23-ka" bands (Fig. 8,
Table 2). In all three frequency bands minimal %chlorite slightly lead (0.5-1.5 ka), and maximal %kaolinite slightly lag (1-4.5 ka) maximal kaolinite/
chlorite-ratio. These phase differences, however,
Isotope and G. menardii Stages
1 I 2 I
3
I 4 I
5
I
6
7
2.0
Z
v
· 1.5 10
Cl
a..
· 1.0
~
.2
1.5
0 ~
iU
·0.5
'" .l!l
a:
~ til
c:
:c 1.0
0 .0
~
0
'0
0 .5
~
co
::.:: 0.5
[:
1.0
0.0
1.5
1.00
~to
0.75
-""
[S] Chi
C\l
E 0.50
u
Cl
ED Kao
a: 0.25
«
0.00
0
20
40
60
80
100
120
140 160 180 200 220
Age (ka)
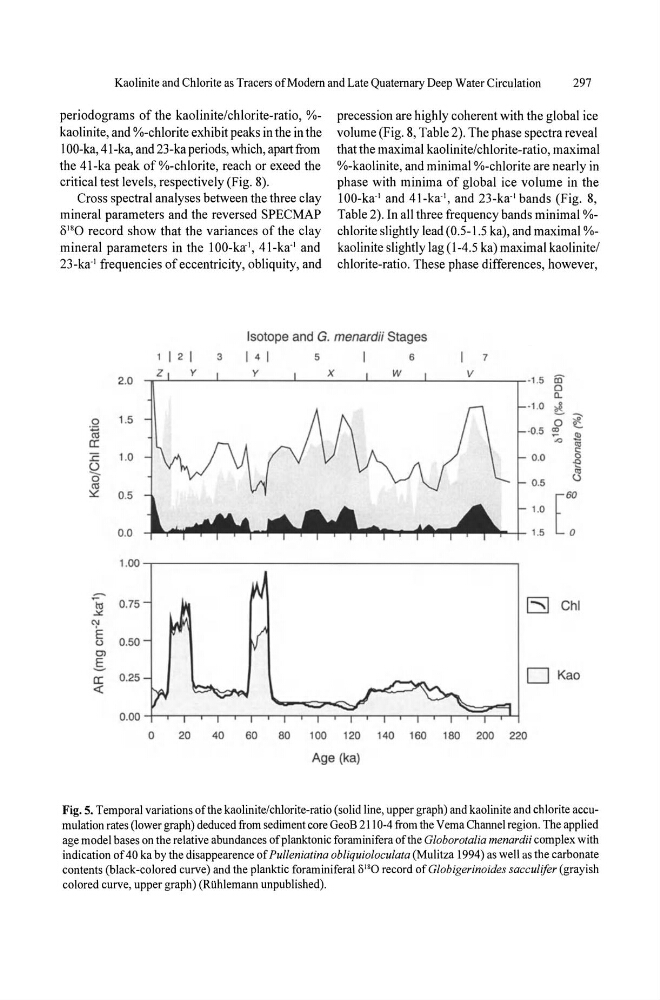
Fig. 5. Temporal variations of the kaolinite/chlorite-ratio (solid line, upper graph) and kaolinite and chlorite accumulation rates (lower graph) deduced from sediment core GeoB 2110-4 from the Vema Channel region. The applied
age model bases on the relative abundances of planktonic foraminifera of the Globorotalia menardii complex with
indication of 40 ka by the disappearence of Pulleniatina obliquioloculata (Mulitza 1994) as well as the carbonate
contents (black-colored curve) and the planktic foraminiferal 1) 18 0 record of Globigerinoides sacculifer (grayish
colored curve, upper graph) (RUhlemann unpublished).
297
periodograms of the kaolinite/chlorite-ratio, %kaolinite, and %-chlorite exhibit peaks in the in the
I OO-ka, 41-ka, and 23-ka periods, which, apart from
the 41-ka peak of %-chlorite, reach or exeed the
critical test levels, respectively (Fig. 8).
Cross spectral analyses between the three clay
mineral parameters and the reversed SPECMAP
8 18 0 record show that the variances of the clay
mineral parameters in the 100-ka" , 41-ka" and
23-ka" frequencies of eccentricity, obliquity, and
precession are highly coherent with the global ice
volume (Fig. 8, Table 2). The phase spectra reveal
that the maximal kaolinite/chlorite-ratio, maximal
%-kaolinite, and minimal %-chlorite are nearly in
phase with minima of global ice volume in the
100-ka" and 41-ka", and 23-ka" bands (Fig. 8,
Table 2). In all three frequency bands minimal %chlorite slightly lead (0.5-1.5 ka), and maximal %kaolinite slightly lag (1-4.5 ka) maximal kaolinite/
chlorite-ratio. These phase differences, however,
Isotope and G. menardii Stages
1 I 2 I
3
I 4 I
5
I
6
7
2.0
Z
v
· 1.5 10
Cl
a..
· 1.0
~
.2
1.5
0 ~
iU
·0.5
'" .l!l
a:
~ til
c:
:c 1.0
0 .0
~
0
'0
0 .5
~
co
::.:: 0.5
[:
1.0
0.0
1.5
1.00
~to
0.75
-""
[S] Chi
C\l
E 0.50
u
Cl
ED Kao
a: 0.25
«
0.00
0
20
40
60
80
100
120
140 160 180 200 220
Age (ka)
Fig. 5. Temporal variations of the kaolinite/chlorite-ratio (solid line, upper graph) and kaolinite and chlorite accumulation rates (lower graph) deduced from sediment core GeoB 2110-4 from the Vema Channel region. The applied
age model bases on the relative abundances of planktonic foraminifera of the Globorotalia menardii complex with
indication of 40 ka by the disappearence of Pulleniatina obliquioloculata (Mulitza 1994) as well as the carbonate
contents (black-colored curve) and the planktic foraminiferal 1) 18 0 record of Globigerinoides sacculifer (grayish
colored curve, upper graph) (RUhlemann unpublished).