

266
Dittert et al.
~
CO,,· Illmol/ksl
W.tcr depth Iml
{:.
() -r-~~--'--~--'-~-.l---'---t- ~--~~--~~--~--~----~~
240
l,OOO
• •
Z,OOO
180
3,000
4.000
1211
5,1100
60
60'S
Equ.tor
20'N
Weslern section
Eastern section
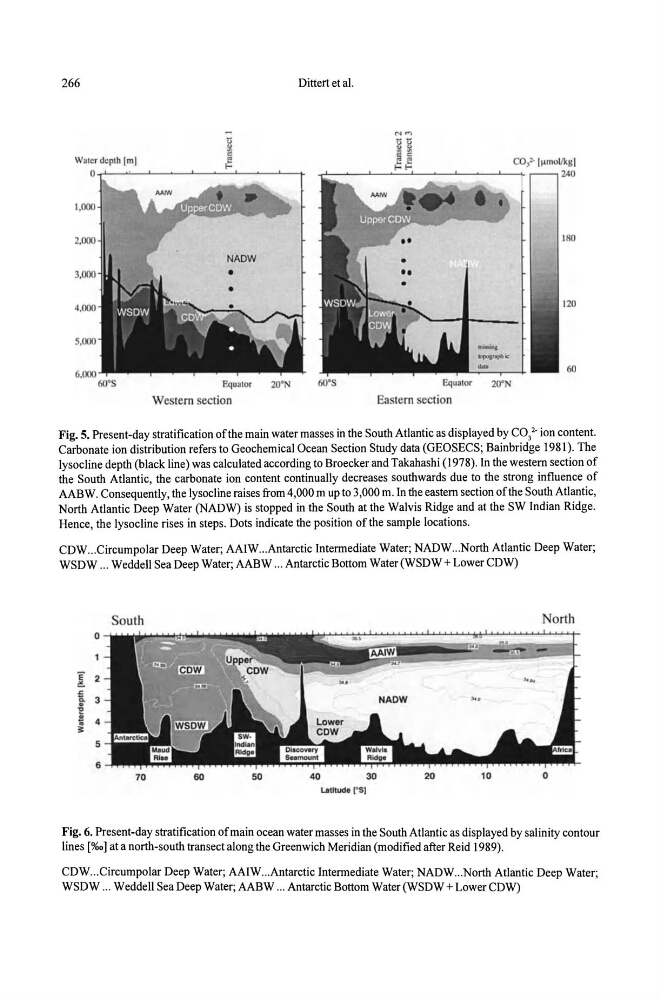
Fig. 5. Present-day stratification of the main water masses in the South Atlantic as displayed by CO,2. ion content.
Carbonate ion distribution refers to Geochemical Ocean Section Study data (GEOSECS; Bainbridge 1981). The
lysocline depth (black line) was calculated according to Broecker and Takahashi (1978). In the western section of
the South Atlantic, the carbonate ion content continually decreases southwards due to the strong influence of
AABW. Consequently, the lysocline raises from 4,000 m up to 3,000 m. In the eastern section of the South Atlantic,
North Atlantic Deep Water (NADW) is stopped in the South at the Walvis Ridge and at the SW Indian Ridge.
Hence, the lysocline rises in steps. Dots indicate the position of the sample locations.
CDW ... Circumpolar Deep Water; AAIW ... Antarctic Intermediate Water; NADW ... North Atlantic Deep Water;
WSDW ... Weddell Sea Deep Water; AABW ... Antarctic Bottom Water (WSDW + Lower CDW)
South
North
0
E
~
2
,5 3
~
~
l! 4
~
5
6
70
60
50
40
30
20
10
o
l.eU1udo ("S)
Fig. 6. Present-day stratification of main ocean water masses in the South Atlantic as displayed by salinity contour
lines [%0] at a north-south transect along the Greenwich Meridian (modified after Reid 1989).
CDW ... Circumpolar Deep Water; AA1W ... Antarctic Intermediate Water; NADW ... North Atlantic Deep Water;
WSDW ... Weddell Sea Deep Water; AABW ... Antarctic Bottom Water (WSDW + Lower CDW)
Dittert et al.
~
CO,,· Illmol/ksl
W.tcr depth Iml
{:.
() -r-~~--'--~--'-~-.l---'---t- ~--~~--~~--~--~----~~
240
l,OOO
• •
Z,OOO
180
3,000
4.000
1211
5,1100
60
60'S
Equ.tor
20'N
Weslern section
Eastern section
Fig. 5. Present-day stratification of the main water masses in the South Atlantic as displayed by CO,2. ion content.
Carbonate ion distribution refers to Geochemical Ocean Section Study data (GEOSECS; Bainbridge 1981). The
lysocline depth (black line) was calculated according to Broecker and Takahashi (1978). In the western section of
the South Atlantic, the carbonate ion content continually decreases southwards due to the strong influence of
AABW. Consequently, the lysocline raises from 4,000 m up to 3,000 m. In the eastern section of the South Atlantic,
North Atlantic Deep Water (NADW) is stopped in the South at the Walvis Ridge and at the SW Indian Ridge.
Hence, the lysocline rises in steps. Dots indicate the position of the sample locations.
CDW ... Circumpolar Deep Water; AAIW ... Antarctic Intermediate Water; NADW ... North Atlantic Deep Water;
WSDW ... Weddell Sea Deep Water; AABW ... Antarctic Bottom Water (WSDW + Lower CDW)
South
North
0
E
~
2
,5 3
~
~
l! 4
~
5
6
70
60
50
40
30
20
10
o
l.eU1udo ("S)
Fig. 6. Present-day stratification of main ocean water masses in the South Atlantic as displayed by salinity contour
lines [%0] at a north-south transect along the Greenwich Meridian (modified after Reid 1989).
CDW ... Circumpolar Deep Water; AA1W ... Antarctic Intermediate Water; NADW ... North Atlantic Deep Water;
WSDW ... Weddell Sea Deep Water; AABW ... Antarctic Bottom Water (WSDW + Lower CDW)