

248
Mackensen and Bickert
1 ;1 2 1 3 1 ' 1 5 I
.
•
.
I ,
o
1 . 2~--------------------------------------~
iii'
o
a..
t
o
0.8
0.4
o
~ -0.4
-0.8
100
200
300
4000m
1041
1117
400
1.2 -r---------------------------------------~
iii'
o
a..
t
U
M
';.,
0.8
0.4
o
-0.4
-0 .8
4600m
1101
1118
·1.2 +------.-----,---;-'----.------,,-----.-----,-----1
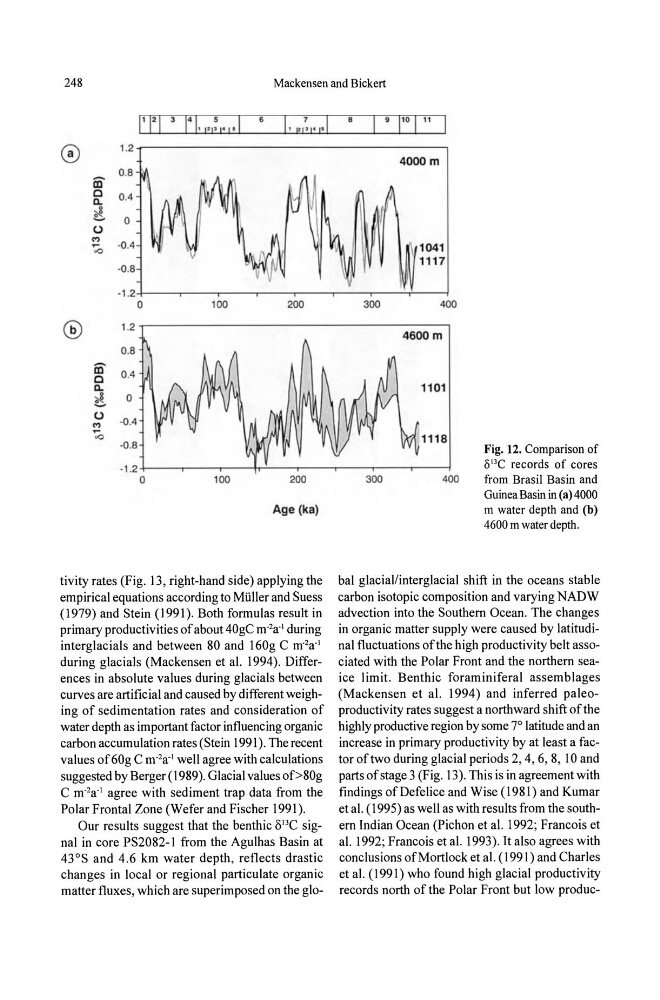
Fig. 12. Comparison of
/)IJC records of cores
from Brasil Basin and
Guinea Basin in (3) 4000
m water depth and (b)
4600 m water depth.
o
100
200
Age (ka)
tivity rates (Fig. 13, right-hand side) applying the
empirical equations according to Muller and Suess
(1979) and Stein (1991). Both formulas result in
primary productivities of about 40gC m- 2 a'! during
interglacials and between 80 and 160g C m 2 a'!
during glacials (Macken sen et al. 1994). Differences in absolute values during glacials between
curves are artificial and caused by different weighing of sedimentation rates and consideration of
water depth as important factor influencing organic
carbon accumulation rates (Stein 1991). The recent
values of 60g C m -
2 a-! well agree with calculations
suggested by Berger (1989). Glacial values of>80g
C m- 2 a-! agree with sediment trap data from the
Polar Frontal Zone (Wefer and Fischer 1991).
Our results suggest that the benthic 8 13 C signal in core PS2082-1 from the Agulhas Basin at
43°S and 4.6 km water depth, reflects drastic
changes in local or regional particulate organic
matter fluxes, which are superimposed on the glo300
400
bal glacial/interglacial shift in the oceans stable
carbon isotopic composition and varying NADW
advection into the Southern Ocean. The changes
in organic matter supply were caused by latitudinal fluctuations of the high productivity belt associated with the Polar Front and the northern seaice limit. Benthic foraminiferal assemblages
(Mackensen et al. 1994) and inferred paleoproductivity rates suggest a northward shift of the
highly productive region by some 7° latitude and an
increase in primary productivity by at least a factor of two during glacial periods 2, 4, 6, 8, 10 and
parts of stage 3 (Fig. 13). This is in agreement with
findings of Defelice and Wise (1981) and Kumar
et al. (1995) as well as with results from the southern Indian Ocean (Pichon et al. 1992; Francois et
at. 1992; Francois et at. 1993). It also agrees with
conclusions of Mort lock et al. (1991) and Charles
et at. (1991) who found high glacial productivity
records north of the Polar Front but low produc-
Mackensen and Bickert
1 ;1 2 1 3 1 ' 1 5 I
.
•
.
I ,
o
1 . 2~--------------------------------------~
iii'
o
a..
t
o
0.8
0.4
o
~ -0.4
-0.8
100
200
300
4000m
1041
1117
400
1.2 -r---------------------------------------~
iii'
o
a..
t
U
M
';.,
0.8
0.4
o
-0.4
-0 .8
4600m
1101
1118
·1.2 +------.-----,---;-'----.------,,-----.-----,-----1
Fig. 12. Comparison of
/)IJC records of cores
from Brasil Basin and
Guinea Basin in (3) 4000
m water depth and (b)
4600 m water depth.
o
100
200
Age (ka)
tivity rates (Fig. 13, right-hand side) applying the
empirical equations according to Muller and Suess
(1979) and Stein (1991). Both formulas result in
primary productivities of about 40gC m- 2 a'! during
interglacials and between 80 and 160g C m 2 a'!
during glacials (Macken sen et al. 1994). Differences in absolute values during glacials between
curves are artificial and caused by different weighing of sedimentation rates and consideration of
water depth as important factor influencing organic
carbon accumulation rates (Stein 1991). The recent
values of 60g C m -
2 a-! well agree with calculations
suggested by Berger (1989). Glacial values of>80g
C m- 2 a-! agree with sediment trap data from the
Polar Frontal Zone (Wefer and Fischer 1991).
Our results suggest that the benthic 8 13 C signal in core PS2082-1 from the Agulhas Basin at
43°S and 4.6 km water depth, reflects drastic
changes in local or regional particulate organic
matter fluxes, which are superimposed on the glo300
400
bal glacial/interglacial shift in the oceans stable
carbon isotopic composition and varying NADW
advection into the Southern Ocean. The changes
in organic matter supply were caused by latitudinal fluctuations of the high productivity belt associated with the Polar Front and the northern seaice limit. Benthic foraminiferal assemblages
(Mackensen et al. 1994) and inferred paleoproductivity rates suggest a northward shift of the
highly productive region by some 7° latitude and an
increase in primary productivity by at least a factor of two during glacial periods 2, 4, 6, 8, 10 and
parts of stage 3 (Fig. 13). This is in agreement with
findings of Defelice and Wise (1981) and Kumar
et al. (1995) as well as with results from the southern Indian Ocean (Pichon et al. 1992; Francois et
at. 1992; Francois et at. 1993). It also agrees with
conclusions of Mort lock et al. (1991) and Charles
et at. (1991) who found high glacial productivity
records north of the Polar Front but low produc-