

On the Reconstruction of Paleo salinities
223
deviations in 0 18 0 of precipitation at the LGM
(louzel et al. 1994; Hoffmann 1995), i.e., an add itionallocal shift oftheo l8 0 w -salinity relationship
towards higher 0 18 0 during glacials (Wolff et al.
1998) might be appropriate and would lower the
overall paleosalinity amplitudes.
The errors associated with paleosalinities reconstructed by MAT and ANN can easily be expressed
in terms of our core-top results. Standard deviations of estimated to measured salinities range between 0.49 and 0.63 %0 . Salinities in the cores
GeoB 1523-1 and RC 12-294 show amplitudes
around I %0 which approximately equals the global glacial-interglacial salinity change due to the
storage of water in the polar ice caps. At first
glance this seems to be more promising than salinity estimates obtained from oxygen isotopes, especially in the tropical regions. On the other hand, we
saw an inverse correlation between salinity and
temperature estimates from MAT at site GeoB 1523
in the ITCZ and a strong positive correlation between the two parameters in core RC 12-294 (Fig.
11). Especially at the latter location we would not
expect salinity decreases during glacials because
salinities were generally increasing in glacial stages
and the core is still located north of a possible meltwater influence (Niebler 1995). The two features
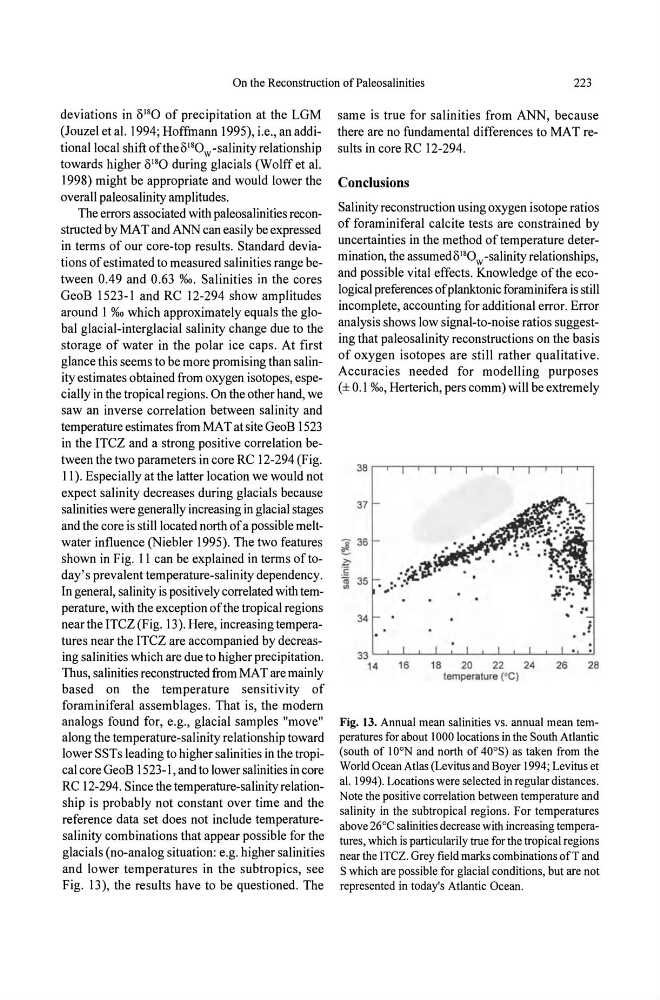
shown in Fig. II can be explained in terms of today's prevalent temperature-salinity dependency.
In general, salinity is positively correlated with temperature, with the exception of the tropical regions
near the ITCZ (Fig. 13). Here, increasing temperatures near the ITCZ are accompanied by decreasing salinities which are due to higher precipitation.
Thus, salinities reconstructed from MAT are mainly
based on the temperature sensitivity of
foraminiferal assemblages. That is, the modern
analogs found for, e. g., glacial samples "move"
along the temperature-salinity relationship toward
lower SSTs leading to higher salinities in the tropical core GeoB 1523-1, and to lower salinities in core
RC 12-294. Since the temperature-salinity relationship is probably not constant over time and the
reference data set does not include temperaturesalinity combinations that appear possible for the
glacials (no-analog situation: e.g. higher salinities
and lower temperatures in the subtropics, see
Fig. 13), the results have to be questioned . The
same is true for salinities from ANN, because
there are no fundamental differences to MAT results in core RC 12-294.
Conclusions
Salinity reconstruction using oxygen isotope ratios
of foraminiferal calcite tests are constrained by
uncertainties in the method of temperature determination, the assumed 0180 W -salinity relationships,
and possible vital effects. Knowledge ofthe ecological preferences of planktonic foraminifera is still
incomplete, accounting for additional error. Error
analysis shows low signal-to-noise ratios suggesting that paleosalinity reconstructions on the basis
of oxygen isotopes are still rather qualitative.
Accuracies needed for modelling purposes
(± 0.1 %0, Herterich, pers comm) will be extremely
37
l 36
~
c:
~ 35
34
,
.. ,-:t.~I'
. "'~
,,'
. "
. '
.. !
33L-L-L-L-L-L-~~~~~-L-L~~
14
16
18
20
22
24
temperature (O C)
26
28
Fig. 13. Annual mean salinities vs. annual mean temperatures for about 1000 locations in the South Atlantic
(south of lOO N and north of 40 0 S) as taken from the
World Ocean Atlas (Levitus and Boyer 1994; Levitus et
al. 1994). Locations were selected in regular distances.
Note the positive correlation between temperature and
salinity in the subtropical regions. For temperatures
above 26°C salinities decrease with increasing temperatures, which is particularily true for the tropical regions
near the !TCZ. Grey field marks combinations ofT and
S which are possible for glacial conditions, but are not
represented in today's Atlantic Ocean.
223
deviations in 0 18 0 of precipitation at the LGM
(louzel et al. 1994; Hoffmann 1995), i.e., an add itionallocal shift oftheo l8 0 w -salinity relationship
towards higher 0 18 0 during glacials (Wolff et al.
1998) might be appropriate and would lower the
overall paleosalinity amplitudes.
The errors associated with paleosalinities reconstructed by MAT and ANN can easily be expressed
in terms of our core-top results. Standard deviations of estimated to measured salinities range between 0.49 and 0.63 %0 . Salinities in the cores
GeoB 1523-1 and RC 12-294 show amplitudes
around I %0 which approximately equals the global glacial-interglacial salinity change due to the
storage of water in the polar ice caps. At first
glance this seems to be more promising than salinity estimates obtained from oxygen isotopes, especially in the tropical regions. On the other hand, we
saw an inverse correlation between salinity and
temperature estimates from MAT at site GeoB 1523
in the ITCZ and a strong positive correlation between the two parameters in core RC 12-294 (Fig.
11). Especially at the latter location we would not
expect salinity decreases during glacials because
salinities were generally increasing in glacial stages
and the core is still located north of a possible meltwater influence (Niebler 1995). The two features
shown in Fig. II can be explained in terms of today's prevalent temperature-salinity dependency.
In general, salinity is positively correlated with temperature, with the exception of the tropical regions
near the ITCZ (Fig. 13). Here, increasing temperatures near the ITCZ are accompanied by decreasing salinities which are due to higher precipitation.
Thus, salinities reconstructed from MAT are mainly
based on the temperature sensitivity of
foraminiferal assemblages. That is, the modern
analogs found for, e. g., glacial samples "move"
along the temperature-salinity relationship toward
lower SSTs leading to higher salinities in the tropical core GeoB 1523-1, and to lower salinities in core
RC 12-294. Since the temperature-salinity relationship is probably not constant over time and the
reference data set does not include temperaturesalinity combinations that appear possible for the
glacials (no-analog situation: e.g. higher salinities
and lower temperatures in the subtropics, see
Fig. 13), the results have to be questioned . The
same is true for salinities from ANN, because
there are no fundamental differences to MAT results in core RC 12-294.
Conclusions
Salinity reconstruction using oxygen isotope ratios
of foraminiferal calcite tests are constrained by
uncertainties in the method of temperature determination, the assumed 0180 W -salinity relationships,
and possible vital effects. Knowledge ofthe ecological preferences of planktonic foraminifera is still
incomplete, accounting for additional error. Error
analysis shows low signal-to-noise ratios suggesting that paleosalinity reconstructions on the basis
of oxygen isotopes are still rather qualitative.
Accuracies needed for modelling purposes
(± 0.1 %0, Herterich, pers comm) will be extremely
37
l 36
~
c:
~ 35
34
,
.. ,-:t.~I'
. "'~
,,'
. "
. '
.. !
33L-L-L-L-L-L-~~~~~-L-L~~
14
16
18
20
22
24
temperature (O C)
26
28
Fig. 13. Annual mean salinities vs. annual mean temperatures for about 1000 locations in the South Atlantic
(south of lOO N and north of 40 0 S) as taken from the
World Ocean Atlas (Levitus and Boyer 1994; Levitus et
al. 1994). Locations were selected in regular distances.
Note the positive correlation between temperature and
salinity in the subtropical regions. For temperatures
above 26°C salinities decrease with increasing temperatures, which is particularily true for the tropical regions
near the !TCZ. Grey field marks combinations ofT and
S which are possible for glacial conditions, but are not
represented in today's Atlantic Ocean.