

222
Wolffetal.
cannot be considered as the total error of the
method. Rosell-MeltS determined an errror of
±0.7°C (95% significance) for calibrations of coretop sediments not including deviations due to regression (Rosell-MeltS et a!. 1995). Sikes and
Volkman (1993) calculated an error envelope of
± 0.6°C for their calibration. Application of calibrations to independent surface sediments and a subsequent comparison with measured temperatures
has not yet been performed. Furthermore, problems
may arise from unresolved questions concerning the
alkenone production throughout the year. Prahl et
a!. (1995) found that temperature calculations on
aiken ones in sediments off the coast of Oregon
show best fits with winter SST. Work in the east
equatorial South Atlantic (Schneider et a!. 1995)
indicated that alkenone temperatures represent
annual mean values. Thus, the downcore temperatures obtained might represent different times of
the annual cycle. An error of 1°C for the alkenone
method is assumed here and might be a realistic
estimation (P. Muller, personal communication).
Vital effects account for the deviation of the
measured foraminiferal 8 18 0 from the theoretically
derived value based on the paleotemperature equation. Literature review shows different vital effects
depending on species, material and location, a fact
that introduces an additional error to the measured
8 18 0 W • Further uncertainty might be introduced by
the basic problem of isotope analysis of planktonic
foraminifera regarding the preference of a particular species for a certain temperature range (Mulitza
et a!. 1998). The errors associated with vital effects
and temperature dependency of foraminifera are
neglected here because they cannot be quantified
yet. However, preliminary estimations show that
they have the potential to add significant uncertainty
to the reconstruction of the 8 18 0 W '
We quantified errors related to the independent
temperature estimate and the analytical error of the
measuring procedure of the foraminiferal 8 18 0.
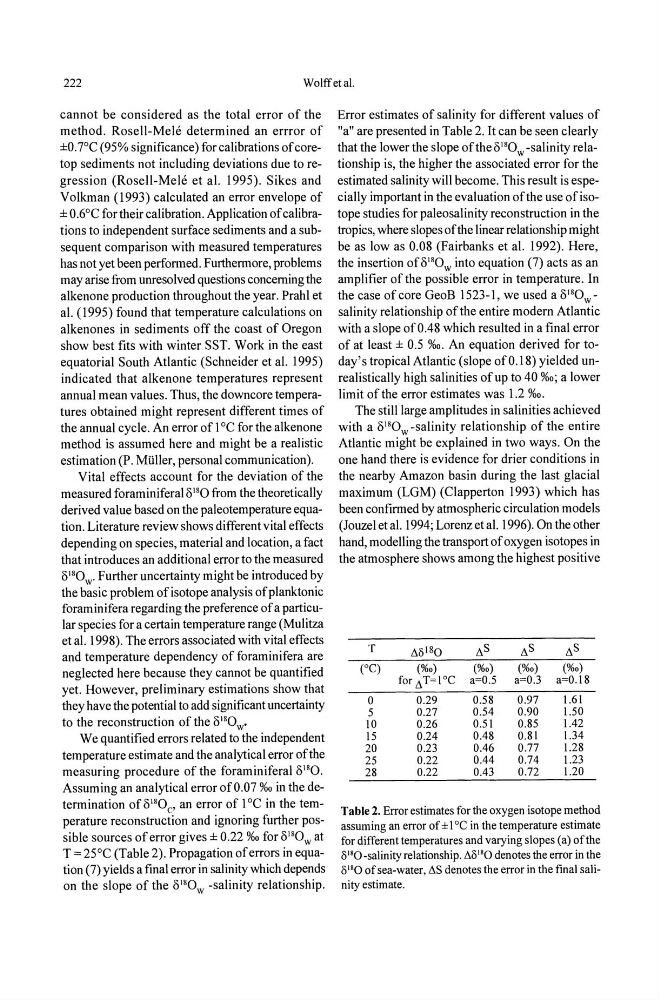
Assuming an analytical error of 0.07 %0 in the determination of 8 18 0 C ' an error of 1°C in the temperature reconstruction and ignoring further possible sources of error gives ± 0.22 %0 for 8 18 0 W at
T = 25°C (Table 2). Propagation of errors in equation (7) yields a final error in salinity which depends
on the slope of the 8 18 0 W -salinity relationship.
Error estimates of salinity for different values of
"a" are presented in Table 2. It can be seen clearly
that the lower the slope of the 8 18 0 W -salinity relationship is, the higher the associated error for the
estimated salinity will become. This result is especially important in the evaluation of the use of isotope studies for paleosalinity reconstruction in the
tropics, where slopes of the linear relationship might
be as low as 0.08 (Fairbanks et al. 1992). Here,
the insertion of8 18 0 w into equation (7) acts as an
amplifier of the possible error in temperature. In
the case of core GeoB 1523-1, we used a 8 18 0 W -
salinity relationship ofthe entire modern Atlantic
with a slope of 0.48 which resulted in a final error
of at least ± 0.5 %0. An equation derived for today's tropical Atlantic (slope of 0.18) yielded unrealistically high salinities of up to 40 %0; a lower
limit of the error estimates was 1.2 %0.
The still large amplitudes in salinities achieved
with a 8 18 0 W -salinity relationship of the entire
Atlantic might be explained in two ways. On the
one hand there is evidence for drier conditions in
the nearby Amazon basin during the last glacial
maximum (LGM) (Clapperton 1993) which has
been confirmed by atmospheric circulation models
(Jouzel et a!. 1994; Lorenz et al. 1996). On the other
hand, modelling the transport of oxygen isotopes in
the atmosphere shows among the highest positive
T
1'.8 18 0
t. S
t. S
t. S
(0C)
(%0)
(%0)
(%0)
(%0)
for I'. T~I °C a~0.5 a~0.3 a~0.18
0
0.29
0.58
0.97
1.61
5
0.27
0.54
0.90
1.50
10
0.26
0.51
0.85
1.42
IS
0.24
0.48
0.81
1.34
20
0.23
0.46
0.77
1.28
25
0.22
0.44
0.74
1.23
28
0.22
0.43
0.72
1.20
Table 2. Error estimates for the oxygen isotope method
assuming an error of ± 1 °C in the temperature estimate
for different temperatures and varying slopes (a) ofthe
8 1 '0-salinity relationship. 1'.8 18 0 denotes the error in the
8 18 0 of sea-water, t.S denotes the error in the final salinity estimate.
Wolffetal.
cannot be considered as the total error of the
method. Rosell-MeltS determined an errror of
±0.7°C (95% significance) for calibrations of coretop sediments not including deviations due to regression (Rosell-MeltS et a!. 1995). Sikes and
Volkman (1993) calculated an error envelope of
± 0.6°C for their calibration. Application of calibrations to independent surface sediments and a subsequent comparison with measured temperatures
has not yet been performed. Furthermore, problems
may arise from unresolved questions concerning the
alkenone production throughout the year. Prahl et
a!. (1995) found that temperature calculations on
aiken ones in sediments off the coast of Oregon
show best fits with winter SST. Work in the east
equatorial South Atlantic (Schneider et a!. 1995)
indicated that alkenone temperatures represent
annual mean values. Thus, the downcore temperatures obtained might represent different times of
the annual cycle. An error of 1°C for the alkenone
method is assumed here and might be a realistic
estimation (P. Muller, personal communication).
Vital effects account for the deviation of the
measured foraminiferal 8 18 0 from the theoretically
derived value based on the paleotemperature equation. Literature review shows different vital effects
depending on species, material and location, a fact
that introduces an additional error to the measured
8 18 0 W • Further uncertainty might be introduced by
the basic problem of isotope analysis of planktonic
foraminifera regarding the preference of a particular species for a certain temperature range (Mulitza
et a!. 1998). The errors associated with vital effects
and temperature dependency of foraminifera are
neglected here because they cannot be quantified
yet. However, preliminary estimations show that
they have the potential to add significant uncertainty
to the reconstruction of the 8 18 0 W '
We quantified errors related to the independent
temperature estimate and the analytical error of the
measuring procedure of the foraminiferal 8 18 0.
Assuming an analytical error of 0.07 %0 in the determination of 8 18 0 C ' an error of 1°C in the temperature reconstruction and ignoring further possible sources of error gives ± 0.22 %0 for 8 18 0 W at
T = 25°C (Table 2). Propagation of errors in equation (7) yields a final error in salinity which depends
on the slope of the 8 18 0 W -salinity relationship.
Error estimates of salinity for different values of
"a" are presented in Table 2. It can be seen clearly
that the lower the slope of the 8 18 0 W -salinity relationship is, the higher the associated error for the
estimated salinity will become. This result is especially important in the evaluation of the use of isotope studies for paleosalinity reconstruction in the
tropics, where slopes of the linear relationship might
be as low as 0.08 (Fairbanks et al. 1992). Here,
the insertion of8 18 0 w into equation (7) acts as an
amplifier of the possible error in temperature. In
the case of core GeoB 1523-1, we used a 8 18 0 W -
salinity relationship ofthe entire modern Atlantic
with a slope of 0.48 which resulted in a final error
of at least ± 0.5 %0. An equation derived for today's tropical Atlantic (slope of 0.18) yielded unrealistically high salinities of up to 40 %0; a lower
limit of the error estimates was 1.2 %0.
The still large amplitudes in salinities achieved
with a 8 18 0 W -salinity relationship of the entire
Atlantic might be explained in two ways. On the
one hand there is evidence for drier conditions in
the nearby Amazon basin during the last glacial
maximum (LGM) (Clapperton 1993) which has
been confirmed by atmospheric circulation models
(Jouzel et a!. 1994; Lorenz et al. 1996). On the other
hand, modelling the transport of oxygen isotopes in
the atmosphere shows among the highest positive
T
1'.8 18 0
t. S
t. S
t. S
(0C)
(%0)
(%0)
(%0)
(%0)
for I'. T~I °C a~0.5 a~0.3 a~0.18
0
0.29
0.58
0.97
1.61
5
0.27
0.54
0.90
1.50
10
0.26
0.51
0.85
1.42
IS
0.24
0.48
0.81
1.34
20
0.23
0.46
0.77
1.28
25
0.22
0.44
0.74
1.23
28
0.22
0.43
0.72
1.20
Table 2. Error estimates for the oxygen isotope method
assuming an error of ± 1 °C in the temperature estimate
for different temperatures and varying slopes (a) ofthe
8 1 '0-salinity relationship. 1'.8 18 0 denotes the error in the
8 18 0 of sea-water, t.S denotes the error in the final salinity estimate.