

On the Reconstruction of Paleosalinities
217
Sample data set
Assemblages
R2 = 0.59
37 SO=1.22·:
'0' 36
C
»
~ 35
m rn
1l 34
iii
E
iJ 33
32 r· ·c ..... . .... ....................... ... ... ,
~
.
31~~LL~~LU~~~~LL~~~-U
31
32
33
34
35
36
37
38
observed salinity (%0)
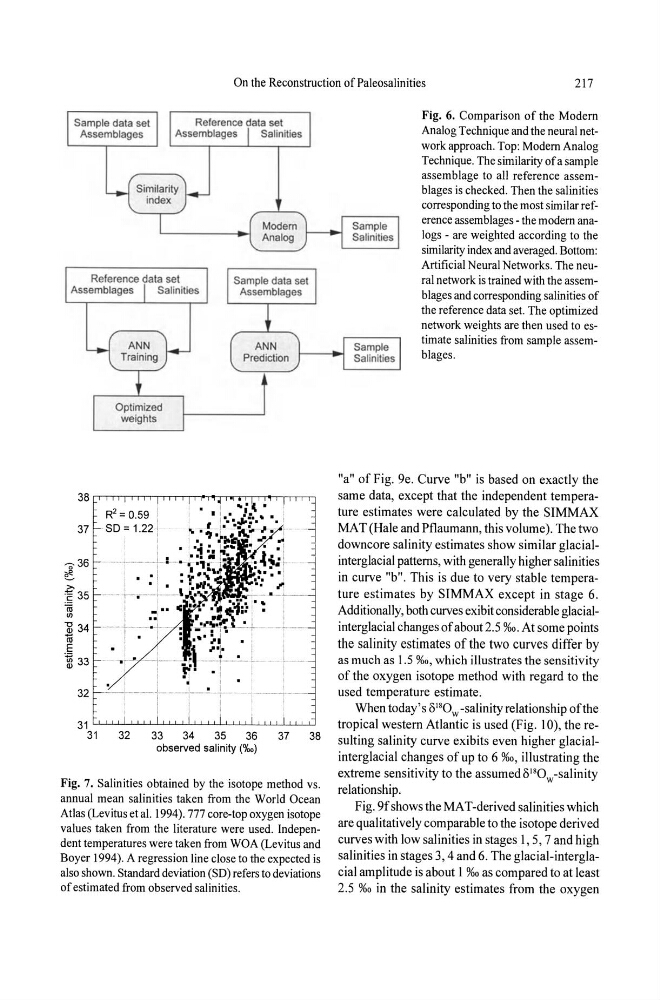
Fig. 7. Salinities obtained by the isotope method vs.
annual mean salinities taken from the World Ocean
Atlas (Levitus et al. 1994).777 core-top oxygen isotope
values taken from the literature were used. Independent temperatures were taken from WOA (Levitus and
Boyer 1994). A regression line close to the expected is
also shown. Standard deviation (SD) refers to deviations
of estimated from observed salinities.
Fig. 6. Comparison of the Modern
Analog Technique and the neural network approach. Top: Modem Analog
Technique. The similarity of a sample
assemblage to all reference assemblages is checked. Then the salinities
corresponding to the most similar reference assemblages -the modern analogs - are weighted according to the
similarity index and averaged. Bottom:
Artificial Neural Networks. The neural network is trained with the assemblages and corresponding salinities of
the reference data set. The optimized
network weights are then used to estimate salinities from sample assemblages.
"a" of Fig. ge. Curve "b" is based on exactly the
same data, except that the independent temperature estimates were calculated by the SIMMAX
MAT (Hale and Pflaumann, this volume). The two
downcore salinity estimates show similar glacialinterglacial patterns, with generally higher salinities
in curve "b". This is due to very stable temperature estimates by SIMMAX except in stage 6.
Additionally, both curves exibit considerable glacialinterglacial changes of about 2.5 %0. At some points
the salinity estimates of the two curves differ by
as much as 1.5 %0, which illustrates the sensitivity
of the oxygen isotope method with regard to the
used temperature estimate.
When today's 8 l8 0 w -salinity relationship of the
tropical western Atlantic is used (Fig. 10), the resulting salinity curve exibits even higher glacialinterglacial changes of up to 6 %0, illustrating the
extreme sensitivity to the assumed 8 18 0 w -salinity
relationship.
Fig. 9f shows the MAT-derived salinities which
are qualitatively comparable to the isotope derived
curves with low salinities in stages 1, 5,7 and high
salinities in stages 3, 4 and 6. The glacial-interglacial amplitude is about 1 %0 as compared to at least
2.5 0/00 in the salinity estimates from the oxygen
217
Sample data set
Assemblages
R2 = 0.59
37 SO=1.22·:
'0' 36
C
»
~ 35
m rn
1l 34
iii
E
iJ 33
32 r· ·c ..... . .... ....................... ... ... ,
~
.
31~~LL~~LU~~~~LL~~~-U
31
32
33
34
35
36
37
38
observed salinity (%0)
Fig. 7. Salinities obtained by the isotope method vs.
annual mean salinities taken from the World Ocean
Atlas (Levitus et al. 1994).777 core-top oxygen isotope
values taken from the literature were used. Independent temperatures were taken from WOA (Levitus and
Boyer 1994). A regression line close to the expected is
also shown. Standard deviation (SD) refers to deviations
of estimated from observed salinities.
Fig. 6. Comparison of the Modern
Analog Technique and the neural network approach. Top: Modem Analog
Technique. The similarity of a sample
assemblage to all reference assemblages is checked. Then the salinities
corresponding to the most similar reference assemblages -the modern analogs - are weighted according to the
similarity index and averaged. Bottom:
Artificial Neural Networks. The neural network is trained with the assemblages and corresponding salinities of
the reference data set. The optimized
network weights are then used to estimate salinities from sample assemblages.
"a" of Fig. ge. Curve "b" is based on exactly the
same data, except that the independent temperature estimates were calculated by the SIMMAX
MAT (Hale and Pflaumann, this volume). The two
downcore salinity estimates show similar glacialinterglacial patterns, with generally higher salinities
in curve "b". This is due to very stable temperature estimates by SIMMAX except in stage 6.
Additionally, both curves exibit considerable glacialinterglacial changes of about 2.5 %0. At some points
the salinity estimates of the two curves differ by
as much as 1.5 %0, which illustrates the sensitivity
of the oxygen isotope method with regard to the
used temperature estimate.
When today's 8 l8 0 w -salinity relationship of the
tropical western Atlantic is used (Fig. 10), the resulting salinity curve exibits even higher glacialinterglacial changes of up to 6 %0, illustrating the
extreme sensitivity to the assumed 8 18 0 w -salinity
relationship.
Fig. 9f shows the MAT-derived salinities which
are qualitatively comparable to the isotope derived
curves with low salinities in stages 1, 5,7 and high
salinities in stages 3, 4 and 6. The glacial-interglacial amplitude is about 1 %0 as compared to at least
2.5 0/00 in the salinity estimates from the oxygen