

Calcareous Dinoflagellate Cysts as Paleo-Environmental Tools
lSI
-.~j ~
:1, - - '
r-. (..:.-z. ~ - ~--..;J
f
' \..,-.f
<--~~o~ - ' )
"
>
,~
. r ,
C .1
"
~v
.
I
\.<€~~,
"' -
~,.. {rJ"t:.
'--r
7">;idi--> (
U l ~ ~Z
'j-r- ~ •
. p' f
" :I: •
~
''\
1
'it,
22 .2~~ ~ ~', JI
, u .... .J.
* /6,)0 n:
(1
~
2,.,.,)5.,),.;::
H O * '.2~O, ,) . • , • .
",,9
*
/" $ ,. ) 1
.. . 0 ,6 (10
0
, . J
( ~ y." *. ll." • i
'''i: IC
212021..21
"1' 20
)
\( \~ ,
_.3i "l 1!"" 3~
D
~\29
~ . IJ
0
b
l * ..
( ' ) .%-'J
11. "
0
1.
IO/s'
""
I
,.
\,
. ',).'41
Jf?
J.. ~ .. , 110' )
I
'f\.
~/ •.. " . . ~ " \ J
(
"\ )
*1' , 41'(;
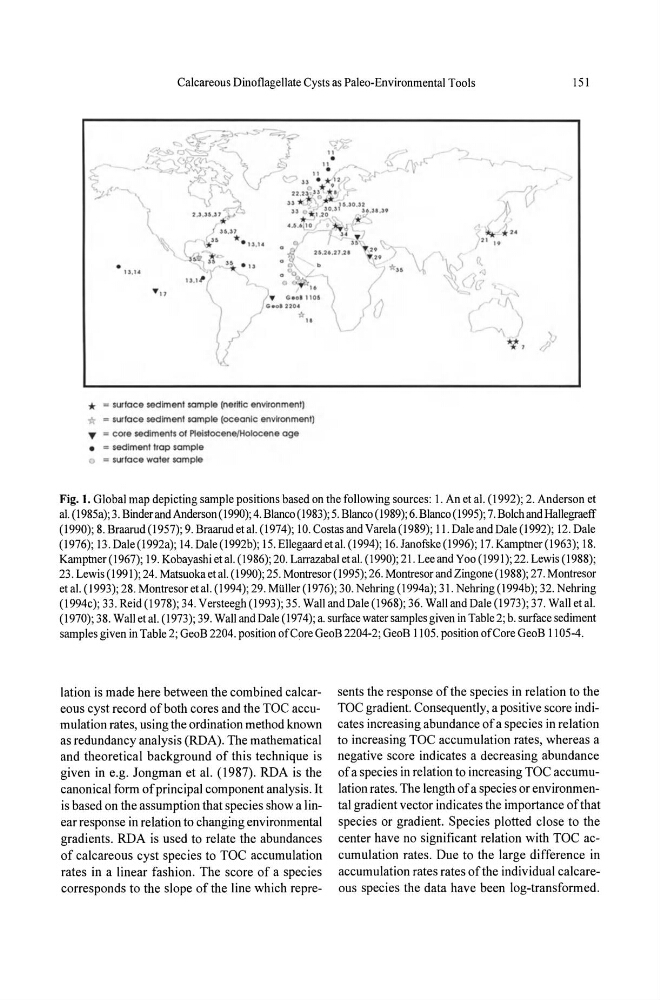
* = surface sediment sample (ner~lc environment)
1>: g surface sediment sample (oceanic environment)
T = core sediments 01 Plelstocene/Holocene age
• = sediment trap sample
o ; ; ; ; ; ; surface water sample
Fig. 1. Global map depicting sample positions based on the following sources: I. An et al. (1992); 2. Anderson et
al. (1985a); 3, Binder and Anderson (1990); 4. Blanco (1983); 5. Blanco (1989); 6. Blanco (1995); 7. Bolch and Hallegraeff
(1990); 8. Braarud (1957); 9. Braarud et al. (1974); 10. Costas and Varela (1989); II. Dale and Dale (1992); 12, Dale
(1976); 13. Dale (1992a); 14. Dale (1992b); 15. Ellegaard etal. (1994); 16. Janofske(1996); 17. Kamptner (1963); 18.
Kamptner(1967); 19. Kobayashi etal. (1986); 20. Larrazabaletal. (1990); 21. Lee and Yoo (1991); 22. Lewis (1988);
23. Lewis (1991); 24. Matsuoka et al. (1990); 25. Montresor (1995); 26. Montresor and Zingone (1988); 27. Montresor
et al. (1993); 28. Montresor etal. (1994); 29. Miiller (1976); 30. Nehring (1994a); 31. Nehring (1994b); 32. Nehring
(1994c); 33. Reid (1978); 34. Versteegh (1993); 35 . Wall and Dale (1968); 36. Wall and Dale (1973); 37. Wall et al.
(1970); 38. Wall et al. (1973); 39. Wall and Dale (1974); a. surface water samples given in Table 2; b. surface sediment
samples given in Table 2; GeoB 2204. position of Core GeoB 2204-2; GeoB 1105. position of Core GeoB 1105-4.
lation is made here between the combined calcareous cyst record of both cores and the TOC accumulation rates, using the ordination method known
as redundancy analysis (RDA). The mathematical
and theoretical background of this technique is
given in e.g. Jongman et al. (1987) . RDA is the
canonical form of principal component analysis. It
is based on the assumption that species show a linear response in relation to changing environmental
gradients. RDA is used to relate the abundances
of calcareous cyst species to TOC accumulation
rates in a linear fashion. The score of a species
corresponds to the slope of the line which represents the response of the species in relation to the
TOC gradient. Consequently, a positive score indicates increasing abundance of a species in relation
to increasing TOC accumulation rates, whereas a
negative score indicates a decreasing abundance
of a species in relation to increasing TOC accumulation rates. The length of a species or environmental gradient vector indicates the importance ofthat
species or gradient. Species plotted close to the
center have no significant relation with TOC accumulation rates. Due to the large difference in
accumulation rates rates of the individual calcareous species the data have been log-transformed.
lSI
-.~j ~
:1, - - '
r-. (..:.-z. ~ - ~--..;J
f
' \..,-.f
<--~~o~ - ' )
"
>
,~
. r ,
C .1
"
~v
.
I
\.<€~~,
"' -
~,.. {rJ"t:.
'--r
7">;idi--> (
U l ~ ~Z
'j-r- ~ •
. p' f
" :I: •
~
''\
1
'it,
22 .2~~ ~ ~', JI
, u .... .J.
* /6,)0 n:
(1
~
2,.,.,)5.,),.;::
H O * '.2~O, ,) . • , • .
",,9
*
/" $ ,. ) 1
.. . 0 ,6 (10
0
, . J
( ~ y." *. ll." • i
'''i: IC
212021..21
"1' 20
)
\( \~ ,
_.3i "l 1!"" 3~
D
~\29
~ . IJ
0
b
l * ..
( ' ) .%-'J
11. "
0
1.
IO/s'
""
I
,.
\,
. ',).'41
Jf?
J.. ~ .. , 110' )
I
'f\.
~/ •.. " . . ~ " \ J
(
"\ )
*1' , 41'(;
* = surface sediment sample (ner~lc environment)
1>: g surface sediment sample (oceanic environment)
T = core sediments 01 Plelstocene/Holocene age
• = sediment trap sample
o ; ; ; ; ; ; surface water sample
Fig. 1. Global map depicting sample positions based on the following sources: I. An et al. (1992); 2. Anderson et
al. (1985a); 3, Binder and Anderson (1990); 4. Blanco (1983); 5. Blanco (1989); 6. Blanco (1995); 7. Bolch and Hallegraeff
(1990); 8. Braarud (1957); 9. Braarud et al. (1974); 10. Costas and Varela (1989); II. Dale and Dale (1992); 12, Dale
(1976); 13. Dale (1992a); 14. Dale (1992b); 15. Ellegaard etal. (1994); 16. Janofske(1996); 17. Kamptner (1963); 18.
Kamptner(1967); 19. Kobayashi etal. (1986); 20. Larrazabaletal. (1990); 21. Lee and Yoo (1991); 22. Lewis (1988);
23. Lewis (1991); 24. Matsuoka et al. (1990); 25. Montresor (1995); 26. Montresor and Zingone (1988); 27. Montresor
et al. (1993); 28. Montresor etal. (1994); 29. Miiller (1976); 30. Nehring (1994a); 31. Nehring (1994b); 32. Nehring
(1994c); 33. Reid (1978); 34. Versteegh (1993); 35 . Wall and Dale (1968); 36. Wall and Dale (1973); 37. Wall et al.
(1970); 38. Wall et al. (1973); 39. Wall and Dale (1974); a. surface water samples given in Table 2; b. surface sediment
samples given in Table 2; GeoB 2204. position of Core GeoB 2204-2; GeoB 1105. position of Core GeoB 1105-4.
lation is made here between the combined calcareous cyst record of both cores and the TOC accumulation rates, using the ordination method known
as redundancy analysis (RDA). The mathematical
and theoretical background of this technique is
given in e.g. Jongman et al. (1987) . RDA is the
canonical form of principal component analysis. It
is based on the assumption that species show a linear response in relation to changing environmental
gradients. RDA is used to relate the abundances
of calcareous cyst species to TOC accumulation
rates in a linear fashion. The score of a species
corresponds to the slope of the line which represents the response of the species in relation to the
TOC gradient. Consequently, a positive score indicates increasing abundance of a species in relation
to increasing TOC accumulation rates, whereas a
negative score indicates a decreasing abundance
of a species in relation to increasing TOC accumulation rates. The length of a species or environmental gradient vector indicates the importance ofthat
species or gradient. Species plotted close to the
center have no significant relation with TOC accumulation rates. Due to the large difference in
accumulation rates rates of the individual calcareous species the data have been log-transformed.