

150
Zonneveld et al.
rates are calculated by linear interpolation between
the dating points. Lithological columns are given in
Fig. 2. For quantitative analysis, the sediment samples derived from these cores were dried overnight
in a stove at 70°C and weighed afterwards. About
19 (samples of Core GeoB 1105-4) and O.Olg
(samples of Core GeoB 2204-2) were added to 100
ml and 5 ml ethanol (40%), respectively. After 30s,
a subsample of 50-1 00 ml was taken directly after
homogenizing the sample. The material was then
transferred to a glass slide. After drying the sample in a stove at 70°C, the material was embedded
in Spurr's resin. Whole slides were counted using
polarized light microscopy as described by Janofske
(1996). Accumulation rates are calculated using the
age models of Bickert (1992) and Riihlemann
(1996).
Surfuce water sarrples
saIqlle
IiitituCIe
wngituCIe
22-S08
01°13' S
24°09'W
22-S1O
00000' S
23°30'W
22-S11
00000' S
17"45'W
22-S13
00000' S
16°51'W
22-S14
OOOOO' S
13°26'W
22-S16
00000' S
11°58'W
22-S17
02°44'N
13°lO'W
22-S18
03°08'N
13°31'W
22-S20
OS°29'N
lS023'W
22-S21
08°50'N
18°42'W
22-S23
l1°29'N
21°03'W
22-S25
W13'N
20014'W
22-S27
lS011'N
19"05' W
22-S32
21°43'N
18°01'W
22-S33
22°23'N
17"49' W
22-S34
22°'2:1'N
17"48' W
22-S35
29"C"XJ'N
15°27'W
22-S37
29"09'N
15°27' W
Surface sediIrent saIqlles
saIqlle
Latitude
Longitude
1602-7
21°1O.9'N
20 0 42.7'W
1606-7
03°03.9'N
11°54.9' W
1607-8
OI°48.2'N
UOI6.4'W
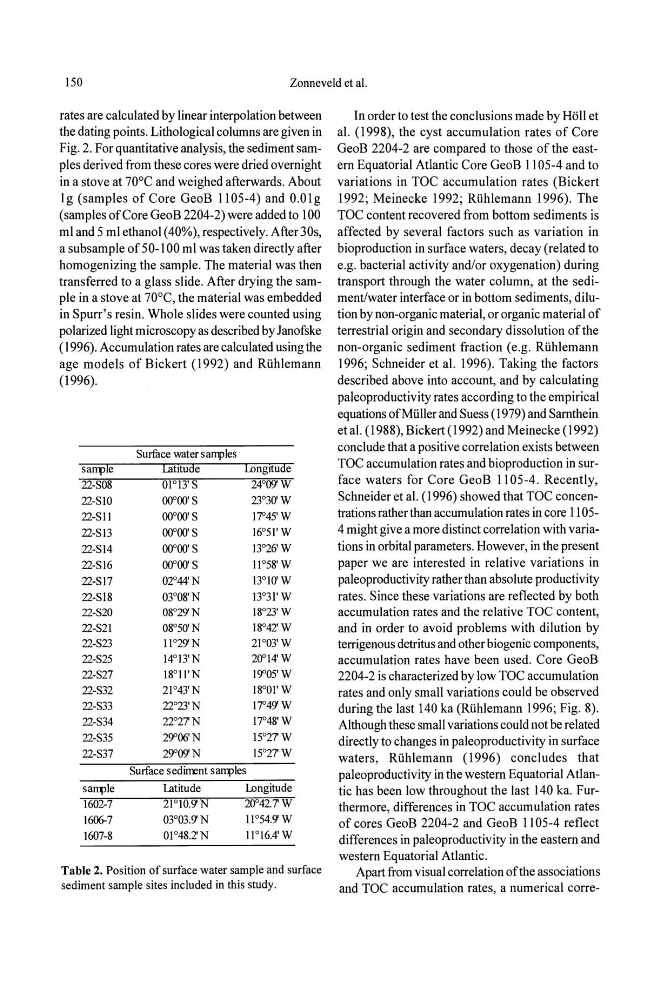
Table 2. Position of surface water sample and surface
sediment sample sites included in this study.
In order to test the conclusions made by Holl et
al. (1998), the cyst accumulation rates of Core
GeoB 2204-2 are compared to those of the eastern Equatorial Atlantic Core GeoB 1105-4 and to
variations in TOC accumulation rates (Bickert
1992; Meinecke 1992; Rtihlemann 1996). The
TOC content recovered from bottom sediments is
affected by several factors such as variation in
bioproduction in surface waters, decay (related to
e.g. bacterial activity and/or oxygenation) during
transport through the water column, at the sediment/water interface or in bottom sediments, dilution by non-organic material, or organic material of
terrestrial origin and secondary dissolution of the
non-organic sediment fraction (e.g. Riihlemann
1996; Schneider et a!. 1996). Taking the factors
described above into account, and by calculating
paleoproductivity rates according to the empirical
equations ofMiiller and Suess (1979) and Samthein
eta!' (1988), Bickert (1992) and Meinecke (1992)
conclude that a positive correlation exists between
TOC accumulation rates and bioproduction in surface waters for Core GeoB 1105-4. Recently,
Schneider et a!. (1996) showed that TOC concentrations rather than accumulation rates in core 11054 might give a more distinct correlation with variations in orbital parameters. However, in the present
paper we are interested in relative variations in
paleoproductivity rather than absolute productivity
rates. Since these variations are reflected by both
accumulation rates and the relative TOC content,
and in order to avoid problems with dilution by
terrigenous detritus and other biogenic components,
accumulation rates have been used. Core GeoB
2204-2 is characterized by low TOC accumulation
rates and only small variations could be observed
during the last 140 ka (Riihlemann 1996; Fig. 8).
Although these small variations could not be related
directly to changes in paleoproductivity in surface
waters, Rtihlemann (1996) concludes that
paleoproductivity in the western Equatorial Atlantic has been low throughout the last 140 ka. Furthermore, differences in TOC accumulation rates
of cores GeoB 2204-2 and GeoB 1105-4 reflect
differences in paleoproductivity in the eastern and
western Equatorial Atlantic.
Apart from visual correlation of the associations
and TOC accumulation rates, a numerical corre-
Zonneveld et al.
rates are calculated by linear interpolation between
the dating points. Lithological columns are given in
Fig. 2. For quantitative analysis, the sediment samples derived from these cores were dried overnight
in a stove at 70°C and weighed afterwards. About
19 (samples of Core GeoB 1105-4) and O.Olg
(samples of Core GeoB 2204-2) were added to 100
ml and 5 ml ethanol (40%), respectively. After 30s,
a subsample of 50-1 00 ml was taken directly after
homogenizing the sample. The material was then
transferred to a glass slide. After drying the sample in a stove at 70°C, the material was embedded
in Spurr's resin. Whole slides were counted using
polarized light microscopy as described by Janofske
(1996). Accumulation rates are calculated using the
age models of Bickert (1992) and Riihlemann
(1996).
Surfuce water sarrples
saIqlle
IiitituCIe
wngituCIe
22-S08
01°13' S
24°09'W
22-S1O
00000' S
23°30'W
22-S11
00000' S
17"45'W
22-S13
00000' S
16°51'W
22-S14
OOOOO' S
13°26'W
22-S16
00000' S
11°58'W
22-S17
02°44'N
13°lO'W
22-S18
03°08'N
13°31'W
22-S20
OS°29'N
lS023'W
22-S21
08°50'N
18°42'W
22-S23
l1°29'N
21°03'W
22-S25
W13'N
20014'W
22-S27
lS011'N
19"05' W
22-S32
21°43'N
18°01'W
22-S33
22°23'N
17"49' W
22-S34
22°'2:1'N
17"48' W
22-S35
29"C"XJ'N
15°27'W
22-S37
29"09'N
15°27' W
Surface sediIrent saIqlles
saIqlle
Latitude
Longitude
1602-7
21°1O.9'N
20 0 42.7'W
1606-7
03°03.9'N
11°54.9' W
1607-8
OI°48.2'N
UOI6.4'W
Table 2. Position of surface water sample and surface
sediment sample sites included in this study.
In order to test the conclusions made by Holl et
al. (1998), the cyst accumulation rates of Core
GeoB 2204-2 are compared to those of the eastern Equatorial Atlantic Core GeoB 1105-4 and to
variations in TOC accumulation rates (Bickert
1992; Meinecke 1992; Rtihlemann 1996). The
TOC content recovered from bottom sediments is
affected by several factors such as variation in
bioproduction in surface waters, decay (related to
e.g. bacterial activity and/or oxygenation) during
transport through the water column, at the sediment/water interface or in bottom sediments, dilution by non-organic material, or organic material of
terrestrial origin and secondary dissolution of the
non-organic sediment fraction (e.g. Riihlemann
1996; Schneider et a!. 1996). Taking the factors
described above into account, and by calculating
paleoproductivity rates according to the empirical
equations ofMiiller and Suess (1979) and Samthein
eta!' (1988), Bickert (1992) and Meinecke (1992)
conclude that a positive correlation exists between
TOC accumulation rates and bioproduction in surface waters for Core GeoB 1105-4. Recently,
Schneider et a!. (1996) showed that TOC concentrations rather than accumulation rates in core 11054 might give a more distinct correlation with variations in orbital parameters. However, in the present
paper we are interested in relative variations in
paleoproductivity rather than absolute productivity
rates. Since these variations are reflected by both
accumulation rates and the relative TOC content,
and in order to avoid problems with dilution by
terrigenous detritus and other biogenic components,
accumulation rates have been used. Core GeoB
2204-2 is characterized by low TOC accumulation
rates and only small variations could be observed
during the last 140 ka (Riihlemann 1996; Fig. 8).
Although these small variations could not be related
directly to changes in paleoproductivity in surface
waters, Rtihlemann (1996) concludes that
paleoproductivity in the western Equatorial Atlantic has been low throughout the last 140 ka. Furthermore, differences in TOC accumulation rates
of cores GeoB 2204-2 and GeoB 1105-4 reflect
differences in paleoproductivity in the eastern and
western Equatorial Atlantic.
Apart from visual correlation of the associations
and TOC accumulation rates, a numerical corre-