

106
Kemle-von MUcke and Oberhansli
G. ruber (from surface sediment)
G. ruber (0-50 m water layer)
%
55
50
••
'0
3S
30
2.
20
"
10
1 : -40 -20 W -10
0
10 E 20
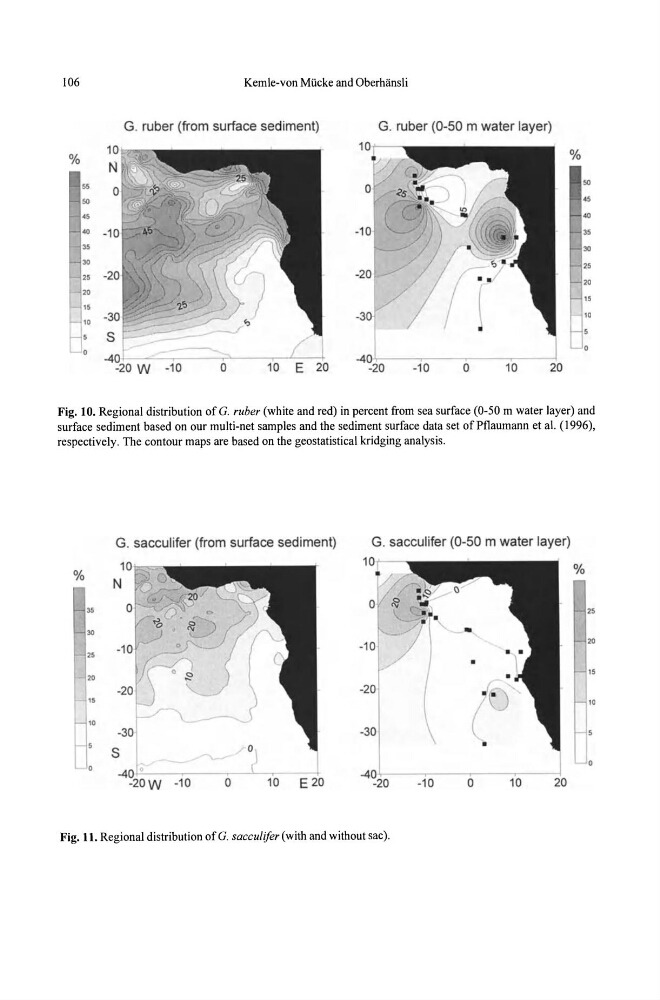
Fig. 10. Regional distribution ofG. ruber (white and red) in percent from sea surface (0-50 m water layer) and
surface sediment based on our multi-net samples and the sediment surface data set of Pflaumann et al. (1996),
respectively. The contour maps are based on the geostatistical kridging analysis.
G. sacculifer (from surface sediment)
%
30
2.
20
'0
G. sacculifer (0-50 m water layer)
101"
-/
o
-20
-30
-40
-20
o
o
10
20
Fig. 11. Regional distribution of G. sacculifer (with and without sac).
%
20
10
Kemle-von MUcke and Oberhansli
G. ruber (from surface sediment)
G. ruber (0-50 m water layer)
%
55
50
••
'0
3S
30
2.
20
"
10
1 : -40 -20 W -10
0
10 E 20
Fig. 10. Regional distribution ofG. ruber (white and red) in percent from sea surface (0-50 m water layer) and
surface sediment based on our multi-net samples and the sediment surface data set of Pflaumann et al. (1996),
respectively. The contour maps are based on the geostatistical kridging analysis.
G. sacculifer (from surface sediment)
%
30
2.
20
'0
G. sacculifer (0-50 m water layer)
101"
-/
o
-20
-30
-40
-20
o
o
10
20
Fig. 11. Regional distribution of G. sacculifer (with and without sac).
%
20
10