

102
Kemle-von MUcke and Oberhansli
% M.F. N. dutertrei
% M.F. G sacculifer (w.o. sac)
% M.F. Gruber white
aj
rEZa >60. >80
bj
2"
0"
2"
4"-N
2"
2"
'.
4"N
4"5
2"
CJ'
2"
4"N
',~
,
".
T
T t T T t
;;:
;;:
;:: ;::
;;:
;::
;::
;:: ;::
;::
z
z
z z
z
z
z
z z
z
:;;:
15
:;;: @
15
:;;:
15
:;;: :;;:
~
a
a
"l
0
0
0
-..
IV
...
'"
'"
... 01
C>
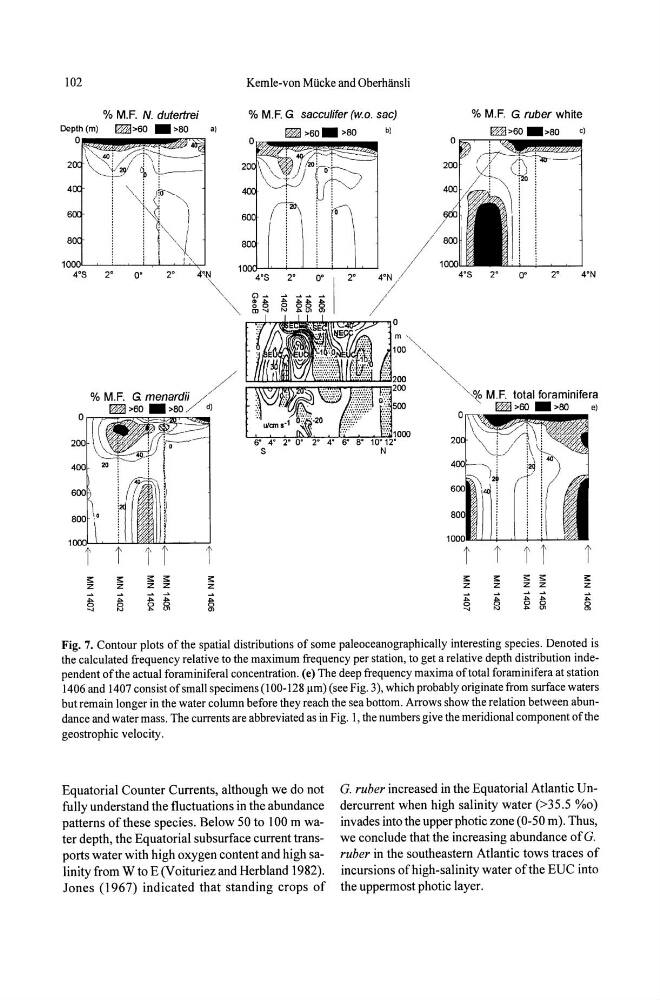
Fig. 7. Contour plots of the spatial distributions of some paleoceanographically interesting species. Denoted is
the calculated frequency relative to the maximum frequency per station, to get a relative depth distribution independent ofthe actual foraminiferal concentration. (e) The deep frequency maxima oftotal foraminifera at station
1406 and 1407 consist of small specimens (100-128 /lm) (see Fig. 3), which probably originate from surface waters
but remain longer in the water column before they reach the sea bottom. Arrows show the relation between abundance and water mass. The currents are abbreviated as in Fig. 1, the numbers give the meridional component of the
geostrophic velocity.
Equatorial Counter Currents, although we do not
fully understand the fluctuations in the abundance
patterns of these species. Below 50 to 100 m water depth, the Equatorial subsurface current transports water with high oxygen content and high salinity from W to E (Voituriez and Herbland 1982).
Jones (1967) indicated that standing crops of
G. ruber increased in the Equatorial Atlantic Undercurrent when high salinity water (>35.5 %0)
invades into the upper photic zone (0-50 m). Thus,
we conclude that the increasing abundance ofG.
ruber in the southeastern Atlantic tows traces of
incursions of high-salinity water of the EUC into
the uppermost photic layer.
Kemle-von MUcke and Oberhansli
% M.F. N. dutertrei
% M.F. G sacculifer (w.o. sac)
% M.F. Gruber white
aj
rEZa >60. >80
bj
2"
0"
2"
4"-N
2"
2"
'.
4"N
4"5
2"
CJ'
2"
4"N
',~
,
".
T
T t T T t
;;:
;;:
;:: ;::
;;:
;::
;::
;:: ;::
;::
z
z
z z
z
z
z
z z
z
:;;:
15
:;;: @
15
:;;:
15
:;;: :;;:
~
a
a
"l
0
0
0
-..
IV
...
'"
'"
... 01
C>
Fig. 7. Contour plots of the spatial distributions of some paleoceanographically interesting species. Denoted is
the calculated frequency relative to the maximum frequency per station, to get a relative depth distribution independent ofthe actual foraminiferal concentration. (e) The deep frequency maxima oftotal foraminifera at station
1406 and 1407 consist of small specimens (100-128 /lm) (see Fig. 3), which probably originate from surface waters
but remain longer in the water column before they reach the sea bottom. Arrows show the relation between abundance and water mass. The currents are abbreviated as in Fig. 1, the numbers give the meridional component of the
geostrophic velocity.
Equatorial Counter Currents, although we do not
fully understand the fluctuations in the abundance
patterns of these species. Below 50 to 100 m water depth, the Equatorial subsurface current transports water with high oxygen content and high salinity from W to E (Voituriez and Herbland 1982).
Jones (1967) indicated that standing crops of
G. ruber increased in the Equatorial Atlantic Undercurrent when high salinity water (>35.5 %0)
invades into the upper photic zone (0-50 m). Thus,
we conclude that the increasing abundance ofG.
ruber in the southeastern Atlantic tows traces of
incursions of high-salinity water of the EUC into
the uppermost photic layer.