

94
Kemle-von Miicke and Oberhiinsli
temperature (0G)
10
20
30
34
salinity (0100)
36
a
0 +----------'-----"------,
I
..c
Q. 100
Q)
TI
'.l!l
~
200
a)
GeoB 1407
1402
1404
1405
1406
oxygen (mill)
2
4
0-,--...L..---7.-:-----,
E
~ 100
t
Q)
TI
I
200
100
200
chl-a (mg/m3)
00
10
a d)
50
100
150
200
OO·OO.5'N; 10·49,8W
01. April 1993
250
0
10
20
temperature ee)
0
30
e)
GeoB 1406 [>----,"-1
1405 i>---$l.re-,.==lrTI
14041>'--==':il:;(1
14021>-~~;::::;;>[
14071> ----c"""'::7I'1
" . .
5£CC
NECC
0""" '~...JI ...... ~ ...... 1PO
ems-1
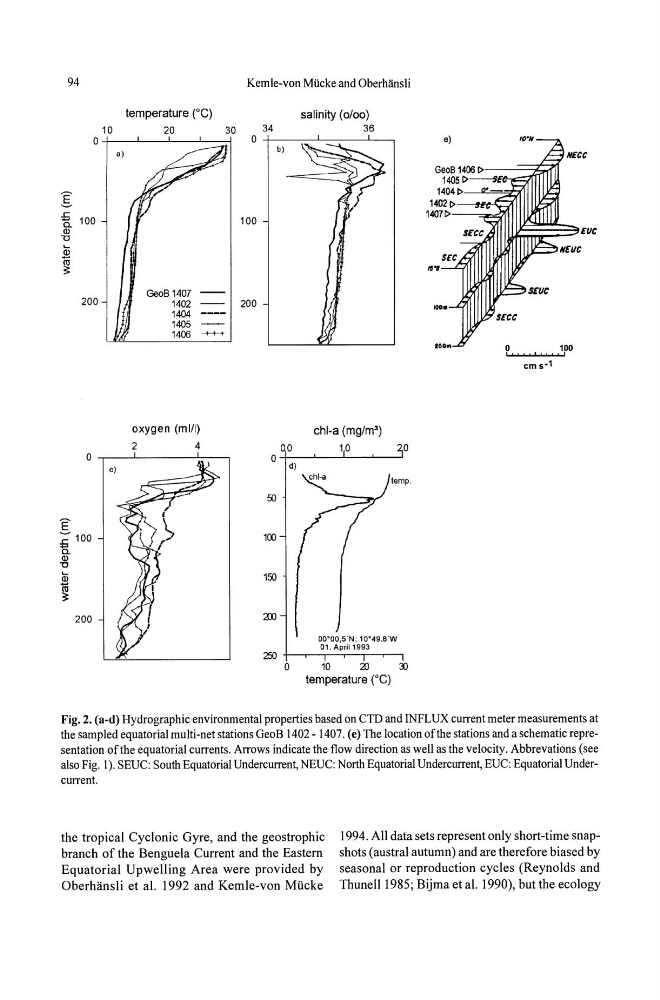
Fig. 2. (a-d) Hydrographic environmental properties based on CTD and INFLUX current meter measurements at
the sampled equatorial multi-net stations GeoB 1402 - 1407. (e) The location of the stations and a schematic representation of the equatorial currents. Arrows indicate the flow direction as well as the velocity. Abbrevations (see
also Fig. 1). SEUC: South Equatorial Undercurrent, NEUC: North Equatorial Undercurrent, EUC: Equatorial Undercurrent.
the tropical Cyclonic Gyre, and the geostrophic
branch of the Benguela Current and the Eastern
Equatorial Upwelling Area were provided by
Oberhansli et a!. 1992 and Kemle-von Miicke
1994. All data sets represent only short-time snapshots (austral autumn) and are therefore biased by
seasonal or reproduction cycles (Reynolds and
Thunell 1985; Bijma et a!. 1990), but the ecology
Kemle-von Miicke and Oberhiinsli
temperature (0G)
10
20
30
34
salinity (0100)
36
a
0 +----------'-----"------,
I
..c
Q. 100
Q)
TI
'.l!l
~
200
a)
GeoB 1407
1402
1404
1405
1406
oxygen (mill)
2
4
0-,--...L..---7.-:-----,
E
~ 100
t
Q)
TI
I
200
100
200
chl-a (mg/m3)
00
10
a d)
50
100
150
200
OO·OO.5'N; 10·49,8W
01. April 1993
250
0
10
20
temperature ee)
0
30
e)
GeoB 1406 [>----,"-1
1405 i>---$l.re-,.==lrTI
14041>'--==':il:;(1
14021>-~~;::::;;>[
14071> ----c"""'::7I'1
" . .
5£CC
NECC
0""" '~...JI ...... ~ ...... 1PO
ems-1
Fig. 2. (a-d) Hydrographic environmental properties based on CTD and INFLUX current meter measurements at
the sampled equatorial multi-net stations GeoB 1402 - 1407. (e) The location of the stations and a schematic representation of the equatorial currents. Arrows indicate the flow direction as well as the velocity. Abbrevations (see
also Fig. 1). SEUC: South Equatorial Undercurrent, NEUC: North Equatorial Undercurrent, EUC: Equatorial Undercurrent.
the tropical Cyclonic Gyre, and the geostrophic
branch of the Benguela Current and the Eastern
Equatorial Upwelling Area were provided by
Oberhansli et a!. 1992 and Kemle-von Miicke
1994. All data sets represent only short-time snapshots (austral autumn) and are therefore biased by
seasonal or reproduction cycles (Reynolds and
Thunell 1985; Bijma et a!. 1990), but the ecology