

Metocean Extreme and Operating Conditions 3.5 Joint Events 63
Part A | 3.5
of the associated wave for the n-y squall case would be
the mean for the entire population of wave-producing
events during the squall season.
Simulations
Numerical simulations are often one of the best ways of
determining associated values. Take, for example, the
challenge of estimating the astronomical tide and storm
surge to associate with the peak wave crest height.
Such a combined event is needed for setting the deck
height on jackets. Fox [3.108] describes a Monte Carlo
approach of numerical simulations to estimate the expected value of the three processes.
Simulations are often the only way to determine
the associated value when there are strong nonlinear
interactions between the two variables. Cooper and
Stear [3.109] describe an example where the Loop Current and a hurricane simultaneously affected a site in
the Gulf of Mexico. While both processes are statistically independent, a tropical cyclone crosses over the
Loop or one of its eddies every 3 years, on average, in
the deep water Gulf. Most crossings are glancing and of
no consequence, but every few decades a hurricane will
cross the western half of an eddy or the Loop, resulting in a strong nonlinear interaction that can magnify
the subsurface ocean currents by four times the linear superposition of the hurricane-only and Loop-only
currents [3.13]. Cooper and Stear [3.109] estimate the
frequency of occurrence of the Loop and hurricane current by shuffling the years from a hindcast historical
dataset with a hindcast Loop/eddy database. They then
use a lookup table of hindcasted joint hurricane/Loop
events to estimate the n-y combined current.
3.5.3 Environmental Contours
The largest structural responses may not come from the
combination of the largest primary variable and the associated secondary variables. For example, the largest
roll response of a floating structure may come from
a lower wave height and a wave period that matches the
roll period. Those cases can be systematically investigated using environmental contours.
Haver and Winterstein [3.110] give a good description of the method and its use. In their example, they
fit an extreme value distribution to the significant wave
height. Then they fit marginal distributions for peak
wave period to ranges of wave height. Finally they fit
the parameters of the marginal distributions so they can
be extrapolated to low wave height probability levels.
This process produces a functional form for the environmental contours of wave height and period.
It is also possible to produce non-parametric environmental contours using a kernel density estimator. In
Data
Hs = 6
Hs = 7
Hs = 8
Hs = 9
Hs = 10
Hs = 11
Hs = 12
Hs = 13
Hs = 14
Hs = 15
Hs = 16
4
6
8
10
12
14
16
18
20
Hs (m)
T p (s)
18
16
14
12
10
8
6
4
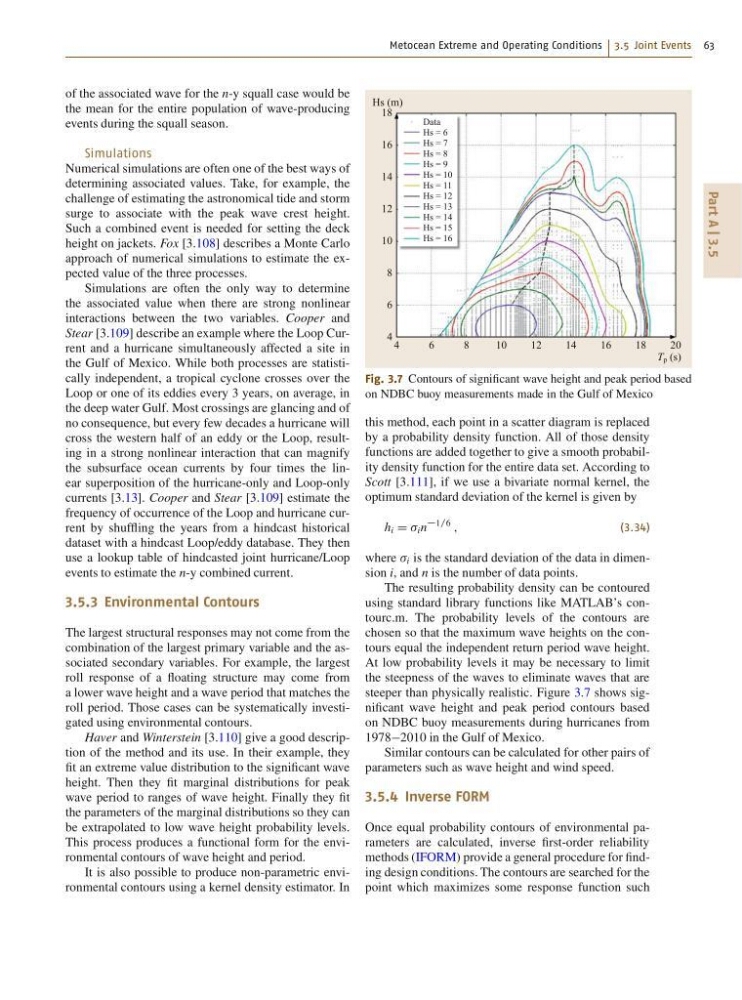
Fig. 3.7 Contours of significant wave height and peak period based
on NDBC buoy measurements made in the Gulf of Mexico
this method, each point in a scatter diagram is replaced
by a probability density function. All of those density
functions are added together to give a smooth probability density function for the entire data set. According to
Scott [3.111], if we use a bivariate normal kernel, the
optimum standard deviation of the kernel is given by
h i D i n
1=6
;
(3.34)
where i is the standard deviation of the data in dimension i, and n is the number of data points.
The resulting probability density can be contoured
using standard library functions like MATLAB’s contourc.m. The probability levels of the contours are
chosen so that the maximum wave heights on the contours equal the independent return period wave height.
At low probability levels it may be necessary to limit
the steepness of the waves to eliminate waves that are
steeper than physically realistic. Figure 3.7 shows significant wave height and peak period contours based
on NDBC buoy measurements during hurricanes from
19782010 in the Gulf of Mexico.
Similar contours can be calculated for other pairs of
parameters such as wave height and wind speed.
3.5.4 Inverse FORM
Once equal probability contours of environmental parameters are calculated, inverse first-order reliability
methods (IFORM) provide a general procedure for finding design conditions. The contours are searched for the
point which maximizes some response function such
Part A | 3.5
of the associated wave for the n-y squall case would be
the mean for the entire population of wave-producing
events during the squall season.
Simulations
Numerical simulations are often one of the best ways of
determining associated values. Take, for example, the
challenge of estimating the astronomical tide and storm
surge to associate with the peak wave crest height.
Such a combined event is needed for setting the deck
height on jackets. Fox [3.108] describes a Monte Carlo
approach of numerical simulations to estimate the expected value of the three processes.
Simulations are often the only way to determine
the associated value when there are strong nonlinear
interactions between the two variables. Cooper and
Stear [3.109] describe an example where the Loop Current and a hurricane simultaneously affected a site in
the Gulf of Mexico. While both processes are statistically independent, a tropical cyclone crosses over the
Loop or one of its eddies every 3 years, on average, in
the deep water Gulf. Most crossings are glancing and of
no consequence, but every few decades a hurricane will
cross the western half of an eddy or the Loop, resulting in a strong nonlinear interaction that can magnify
the subsurface ocean currents by four times the linear superposition of the hurricane-only and Loop-only
currents [3.13]. Cooper and Stear [3.109] estimate the
frequency of occurrence of the Loop and hurricane current by shuffling the years from a hindcast historical
dataset with a hindcast Loop/eddy database. They then
use a lookup table of hindcasted joint hurricane/Loop
events to estimate the n-y combined current.
3.5.3 Environmental Contours
The largest structural responses may not come from the
combination of the largest primary variable and the associated secondary variables. For example, the largest
roll response of a floating structure may come from
a lower wave height and a wave period that matches the
roll period. Those cases can be systematically investigated using environmental contours.
Haver and Winterstein [3.110] give a good description of the method and its use. In their example, they
fit an extreme value distribution to the significant wave
height. Then they fit marginal distributions for peak
wave period to ranges of wave height. Finally they fit
the parameters of the marginal distributions so they can
be extrapolated to low wave height probability levels.
This process produces a functional form for the environmental contours of wave height and period.
It is also possible to produce non-parametric environmental contours using a kernel density estimator. In
Data
Hs = 6
Hs = 7
Hs = 8
Hs = 9
Hs = 10
Hs = 11
Hs = 12
Hs = 13
Hs = 14
Hs = 15
Hs = 16
4
6
8
10
12
14
16
18
20
Hs (m)
T p (s)
18
16
14
12
10
8
6
4
Fig. 3.7 Contours of significant wave height and peak period based
on NDBC buoy measurements made in the Gulf of Mexico
this method, each point in a scatter diagram is replaced
by a probability density function. All of those density
functions are added together to give a smooth probability density function for the entire data set. According to
Scott [3.111], if we use a bivariate normal kernel, the
optimum standard deviation of the kernel is given by
h i D i n
1=6
;
(3.34)
where i is the standard deviation of the data in dimension i, and n is the number of data points.
The resulting probability density can be contoured
using standard library functions like MATLAB’s contourc.m. The probability levels of the contours are
chosen so that the maximum wave heights on the contours equal the independent return period wave height.
At low probability levels it may be necessary to limit
the steepness of the waves to eliminate waves that are
steeper than physically realistic. Figure 3.7 shows significant wave height and peak period contours based
on NDBC buoy measurements during hurricanes from
19782010 in the Gulf of Mexico.
Similar contours can be calculated for other pairs of
parameters such as wave height and wind speed.
3.5.4 Inverse FORM
Once equal probability contours of environmental parameters are calculated, inverse first-order reliability
methods (IFORM) provide a general procedure for finding design conditions. The contours are searched for the
point which maximizes some response function such