

Part A | 3.5
62 Part A Fundamentals
3.5.2 Load Cases
As discussed in the previous section, a response-based
analysis is generally the preferred approach in developing extreme criteria, but in practice the response
function is often not easily simplified, so metocean specialists are requested to develop so-called load cases.
These consist of likely combinations of wind, wave, and
current that could cause the n-y load or response. For instance, one common load case would be the n-y wave
and the associated wind (the most likely wind velocity
to occur simultaneously with the n-y wave condition)
and associated current. Another analogous case would
be the n-y current and associated wind and wave. ANSI/
API [3.1] makes routine use of load cases in their recommended practice.
There are two main questions to be answered when
using load cases: What combinations of wind, wave, and
current can cause the n-y load/response? How is the
associated value found? Answering the first question is
straightforward for well-studied facilities like offshore
jackets. That is because previous work has shown that
the n-y load for key global responses like base shear
and overturning moment occurs during the n-y wave
and associated wind/current. Other combinations such
as the n-y wind and associated wave and current, come
close but do not exceed the n-y wave case. However, for
other facility types this may not be true and so there is
a risk of missing load combinations with n-y recurrence
that exceed traditional cases like the n-y wave and associated wind/current. One way to mitigate this risk is
to provide a broad range of possible load cases, though
a firm justification for those cases may be difficult to establish unless a response-based analysis is performed.
Several methods have been developed to answer the
second question and these are discussed in the following sections.
Regression Analysis
Using a regression analysis to find the associated values can be straightforward, especially when the primary
and secondary variables are well correlated. The analyst starts by estimating the n-y value of the primary
variable using a peak-over-threshold (POT) method, as
described in Sect. 3.7.2. Next, a scatter plot is made
of the coincident (in time) primary and secondary variables. If there is some correlation evident in the plot, the
data is fit with a curve to derive an equation expressing
the secondary variable in terms of the primary one. The
associated value can then be found by substituting the
n-y primary variable into the equation.
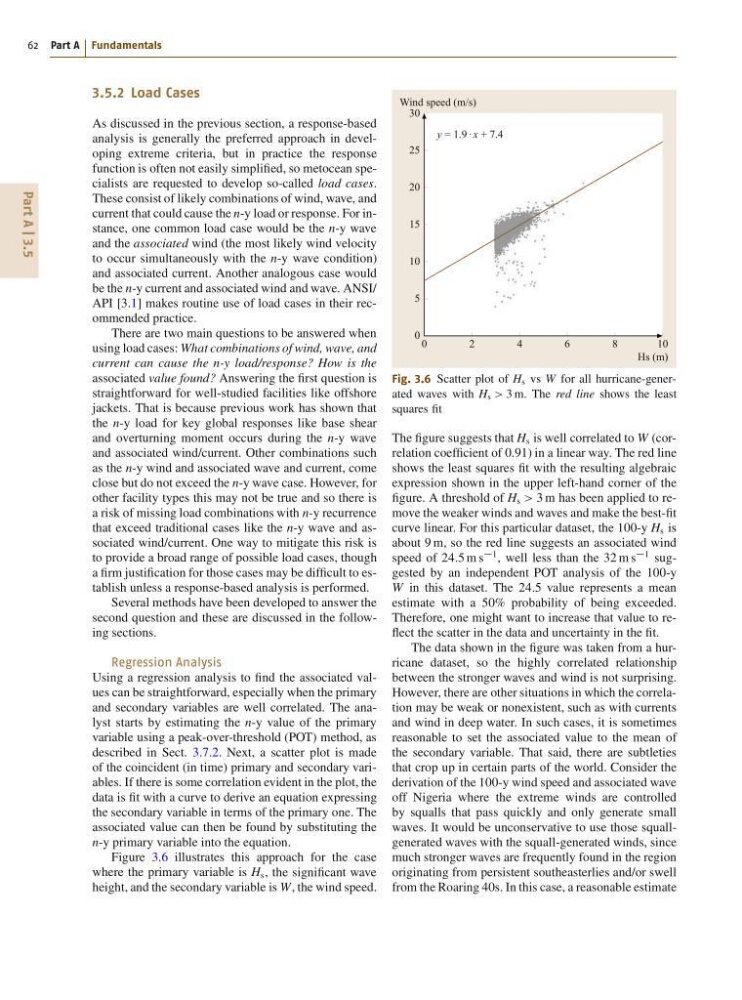
Figure 3.6 illustrates this approach for the case
where the primary variable is H s , the significant wave
height, and the secondary variable is W, the wind speed.
0
2
4
6
8
1 0
Wind speed (m/s)
y = 1.9 · x + 7.4
Hs (m)
30
25
20
15
10
5
0
Fig. 3.6 Scatter plot of H s vs W for all hurricane-generated waves with H s > 3 m. The red line shows the least
squares fit
The figure suggests that H s is well correlated to W (correlation coefficient of 0.91) in a linear way. The red line
shows the least squares fit with the resulting algebraic
expression shown in the upper left-hand corner of the
figure. A threshold of H s > 3 m has been applied to remove the weaker winds and waves and make the best-fit
curve linear. For this particular dataset, the 100-y H s is
about 9 m, so the red line suggests an associated wind
speed of 24:5 m s
1 , well less than the 32 m s
1 suggested by an independent POT analysis of the 100-y
W in this dataset. The 24.5 value represents a mean
estimate with a 50% probability of being exceeded.
Therefore, one might want to increase that value to reflect the scatter in the data and uncertainty in the fit.
The data shown in the figure was taken from a hurricane dataset, so the highly correlated relationship
between the stronger waves and wind is not surprising.
However, there are other situations in which the correlation may be weak or nonexistent, such as with currents
and wind in deep water. In such cases, it is sometimes
reasonable to set the associated value to the mean of
the secondary variable. That said, there are subtleties
that crop up in certain parts of the world. Consider the
derivation of the 100-y wind speed and associated wave
off Nigeria where the extreme winds are controlled
by squalls that pass quickly and only generate small
waves. It would be unconservative to use those squallgenerated waves with the squall-generated winds, since
much stronger waves are frequently found in the region
originating from persistent southeasterlies and/or swell
from the Roaring 40s. In this case, a reasonable estimate
62 Part A Fundamentals
3.5.2 Load Cases
As discussed in the previous section, a response-based
analysis is generally the preferred approach in developing extreme criteria, but in practice the response
function is often not easily simplified, so metocean specialists are requested to develop so-called load cases.
These consist of likely combinations of wind, wave, and
current that could cause the n-y load or response. For instance, one common load case would be the n-y wave
and the associated wind (the most likely wind velocity
to occur simultaneously with the n-y wave condition)
and associated current. Another analogous case would
be the n-y current and associated wind and wave. ANSI/
API [3.1] makes routine use of load cases in their recommended practice.
There are two main questions to be answered when
using load cases: What combinations of wind, wave, and
current can cause the n-y load/response? How is the
associated value found? Answering the first question is
straightforward for well-studied facilities like offshore
jackets. That is because previous work has shown that
the n-y load for key global responses like base shear
and overturning moment occurs during the n-y wave
and associated wind/current. Other combinations such
as the n-y wind and associated wave and current, come
close but do not exceed the n-y wave case. However, for
other facility types this may not be true and so there is
a risk of missing load combinations with n-y recurrence
that exceed traditional cases like the n-y wave and associated wind/current. One way to mitigate this risk is
to provide a broad range of possible load cases, though
a firm justification for those cases may be difficult to establish unless a response-based analysis is performed.
Several methods have been developed to answer the
second question and these are discussed in the following sections.
Regression Analysis
Using a regression analysis to find the associated values can be straightforward, especially when the primary
and secondary variables are well correlated. The analyst starts by estimating the n-y value of the primary
variable using a peak-over-threshold (POT) method, as
described in Sect. 3.7.2. Next, a scatter plot is made
of the coincident (in time) primary and secondary variables. If there is some correlation evident in the plot, the
data is fit with a curve to derive an equation expressing
the secondary variable in terms of the primary one. The
associated value can then be found by substituting the
n-y primary variable into the equation.
Figure 3.6 illustrates this approach for the case
where the primary variable is H s , the significant wave
height, and the secondary variable is W, the wind speed.
0
2
4
6
8
1 0
Wind speed (m/s)
y = 1.9 · x + 7.4
Hs (m)
30
25
20
15
10
5
0
Fig. 3.6 Scatter plot of H s vs W for all hurricane-generated waves with H s > 3 m. The red line shows the least
squares fit
The figure suggests that H s is well correlated to W (correlation coefficient of 0.91) in a linear way. The red line
shows the least squares fit with the resulting algebraic
expression shown in the upper left-hand corner of the
figure. A threshold of H s > 3 m has been applied to remove the weaker winds and waves and make the best-fit
curve linear. For this particular dataset, the 100-y H s is
about 9 m, so the red line suggests an associated wind
speed of 24:5 m s
1 , well less than the 32 m s
1 suggested by an independent POT analysis of the 100-y
W in this dataset. The 24.5 value represents a mean
estimate with a 50% probability of being exceeded.
Therefore, one might want to increase that value to reflect the scatter in the data and uncertainty in the fit.
The data shown in the figure was taken from a hurricane dataset, so the highly correlated relationship
between the stronger waves and wind is not surprising.
However, there are other situations in which the correlation may be weak or nonexistent, such as with currents
and wind in deep water. In such cases, it is sometimes
reasonable to set the associated value to the mean of
the secondary variable. That said, there are subtleties
that crop up in certain parts of the world. Consider the
derivation of the 100-y wind speed and associated wave
off Nigeria where the extreme winds are controlled
by squalls that pass quickly and only generate small
waves. It would be unconservative to use those squallgenerated waves with the squall-generated winds, since
much stronger waves are frequently found in the region
originating from persistent southeasterlies and/or swell
from the Roaring 40s. In this case, a reasonable estimate