

Metocean Extreme and Operating Conditions 3.3 Measurements 55
Part A | 3.3
3
6
9
12
15 E 180° 15
12
9
6
3 W 0°
3
World ocean
N
S
60°
30°
0°
30°
60°
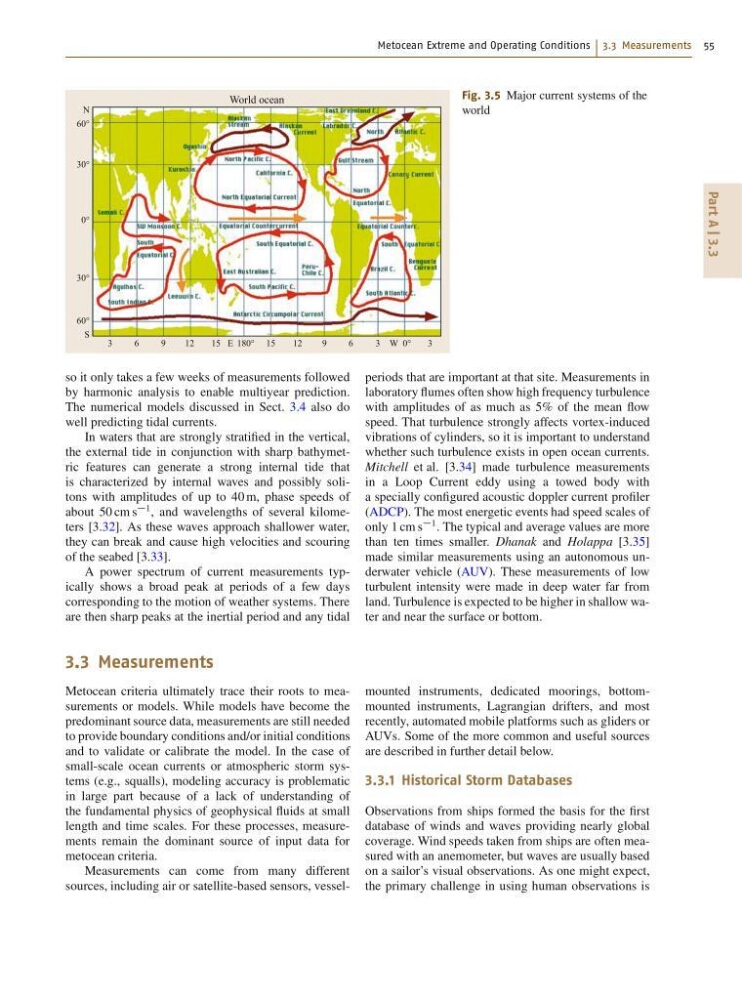
Fig. 3.5 Major current systems of the
world
so it only takes a few weeks of measurements followed
by harmonic analysis to enable multiyear prediction.
The numerical models discussed in Sect. 3.4 also do
well predicting tidal currents.
In waters that are strongly stratified in the vertical,
the external tide in conjunction with sharp bathymetric features can generate a strong internal tide that
is characterized by internal waves and possibly solitons with amplitudes of up to 40 m, phase speeds of
about 50 cm s
1 , and wavelengths of several kilometers [3.32]. As these waves approach shallower water,
they can break and cause high velocities and scouring
of the seabed [3.33].
A power spectrum of current measurements typically shows a broad peak at periods of a few days
corresponding to the motion of weather systems. There
are then sharp peaks at the inertial period and any tidal
periods that are important at that site. Measurements in
laboratory flumes often show high frequency turbulence
with amplitudes of as much as 5% of the mean flow
speed. That turbulence strongly affects vortex-induced
vibrations of cylinders, so it is important to understand
whether such turbulence exists in open ocean currents.
Mitchell et al. [3.34] made turbulence measurements
in a Loop Current eddy using a towed body with
a specially configured acoustic doppler current profiler
(ADCP). The most energetic events had speed scales of
only 1 cm s
1 . The typical and average values are more
than ten times smaller. Dhanak and Holappa [3.35]
made similar measurements using an autonomous underwater vehicle (AUV). These measurements of low
turbulent intensity were made in deep water far from
land. Turbulence is expected to be higher in shallow water and near the surface or bottom.
3.3 Measurements
Metocean criteria ultimately trace their roots to measurements or models. While models have become the
predominant source data, measurements are still needed
to provide boundary conditions and/or initial conditions
and to validate or calibrate the model. In the case of
small-scale ocean currents or atmospheric storm systems (e.g., squalls), modeling accuracy is problematic
in large part because of a lack of understanding of
the fundamental physics of geophysical fluids at small
length and time scales. For these processes, measurements remain the dominant source of input data for
metocean criteria.
Measurements can come from many different
sources, including air or satellite-based sensors, vesselmounted instruments, dedicated moorings, bottommounted instruments, Lagrangian drifters, and most
recently, automated mobile platforms such as gliders or
AUVs. Some of the more common and useful sources
are described in further detail below.
3.3.1 Historical Storm Databases
Observations from ships formed the basis for the first
database of winds and waves providing nearly global
coverage. Wind speeds taken from ships are often measured with an anemometer, but waves are usually based
on a sailor’s visual observations. As one might expect,
the primary challenge in using human observations is
Part A | 3.3
3
6
9
12
15 E 180° 15
12
9
6
3 W 0°
3
World ocean
N
S
60°
30°
0°
30°
60°
Fig. 3.5 Major current systems of the
world
so it only takes a few weeks of measurements followed
by harmonic analysis to enable multiyear prediction.
The numerical models discussed in Sect. 3.4 also do
well predicting tidal currents.
In waters that are strongly stratified in the vertical,
the external tide in conjunction with sharp bathymetric features can generate a strong internal tide that
is characterized by internal waves and possibly solitons with amplitudes of up to 40 m, phase speeds of
about 50 cm s
1 , and wavelengths of several kilometers [3.32]. As these waves approach shallower water,
they can break and cause high velocities and scouring
of the seabed [3.33].
A power spectrum of current measurements typically shows a broad peak at periods of a few days
corresponding to the motion of weather systems. There
are then sharp peaks at the inertial period and any tidal
periods that are important at that site. Measurements in
laboratory flumes often show high frequency turbulence
with amplitudes of as much as 5% of the mean flow
speed. That turbulence strongly affects vortex-induced
vibrations of cylinders, so it is important to understand
whether such turbulence exists in open ocean currents.
Mitchell et al. [3.34] made turbulence measurements
in a Loop Current eddy using a towed body with
a specially configured acoustic doppler current profiler
(ADCP). The most energetic events had speed scales of
only 1 cm s
1 . The typical and average values are more
than ten times smaller. Dhanak and Holappa [3.35]
made similar measurements using an autonomous underwater vehicle (AUV). These measurements of low
turbulent intensity were made in deep water far from
land. Turbulence is expected to be higher in shallow water and near the surface or bottom.
3.3 Measurements
Metocean criteria ultimately trace their roots to measurements or models. While models have become the
predominant source data, measurements are still needed
to provide boundary conditions and/or initial conditions
and to validate or calibrate the model. In the case of
small-scale ocean currents or atmospheric storm systems (e.g., squalls), modeling accuracy is problematic
in large part because of a lack of understanding of
the fundamental physics of geophysical fluids at small
length and time scales. For these processes, measurements remain the dominant source of input data for
metocean criteria.
Measurements can come from many different
sources, including air or satellite-based sensors, vesselmounted instruments, dedicated moorings, bottommounted instruments, Lagrangian drifters, and most
recently, automated mobile platforms such as gliders or
AUVs. Some of the more common and useful sources
are described in further detail below.
3.3.1 Historical Storm Databases
Observations from ships formed the basis for the first
database of winds and waves providing nearly global
coverage. Wind speeds taken from ships are often measured with an anemometer, but waves are usually based
on a sailor’s visual observations. As one might expect,
the primary challenge in using human observations is