

Metocean Extreme and Operating Conditions 3.2 Overview of WWC Processes 53
Part A | 3.2
where
˛ D
r
1
8
C 0:2568S 1 C 0:0800Ur ;
ˇ D 2 1:7912S 1 0:5302Ur C 0:2824Ur
2
: (3.30)
The mean steepness and Ursell number are given by
S 1 D
2
g
H s
T
2
1
;
Ur D
H s
k
2
1 d 3 :
(3.31)
The wave and crest height distributions in (3.27)–(3.29)
do not take into account higher-order nonlinearities that
may lead to rogue waves. The evidence for rogue waves
and possible theoretical reasons for their existence are
discussed in Sect. 3.7.9.
Representing waves as a Fourier series makes the
tacit assumption that the waves do not break. A Fourier
series, and most wave theories, cannot handle doublevalued time series. Yet during a storm, the sea is covered
with breaking waves [3.21]. Fortunately, almost all of
these breaking events are spilling events that only affect
a small portion of the wave crest. Because of this design
calculations in deep water typically ignore breaking.
Measured forces and the survival of structures in severe
storms indicate that neglecting deep water breaking
waves does not change wave forces significantly [3.22].
The situation is completely different near the shore.
The transformation of wave spectra near the shore
is modeled by specialized hindcasting tools such as
SWAN (Simulating WAves Nearshore) [3.23]. Shoaling
waves can steepen rapidly and form a plunging breaker.
Longuet-Higgins and Cokelet [3.24] succeeded in integrating the equations of motion in a free surface flow
past overturning many years ago. Such computations
show that particle velocities in the crest of plunging
breakers can exceed the phase velocity of the wave and
are much higher than particle velocities in non-breaking
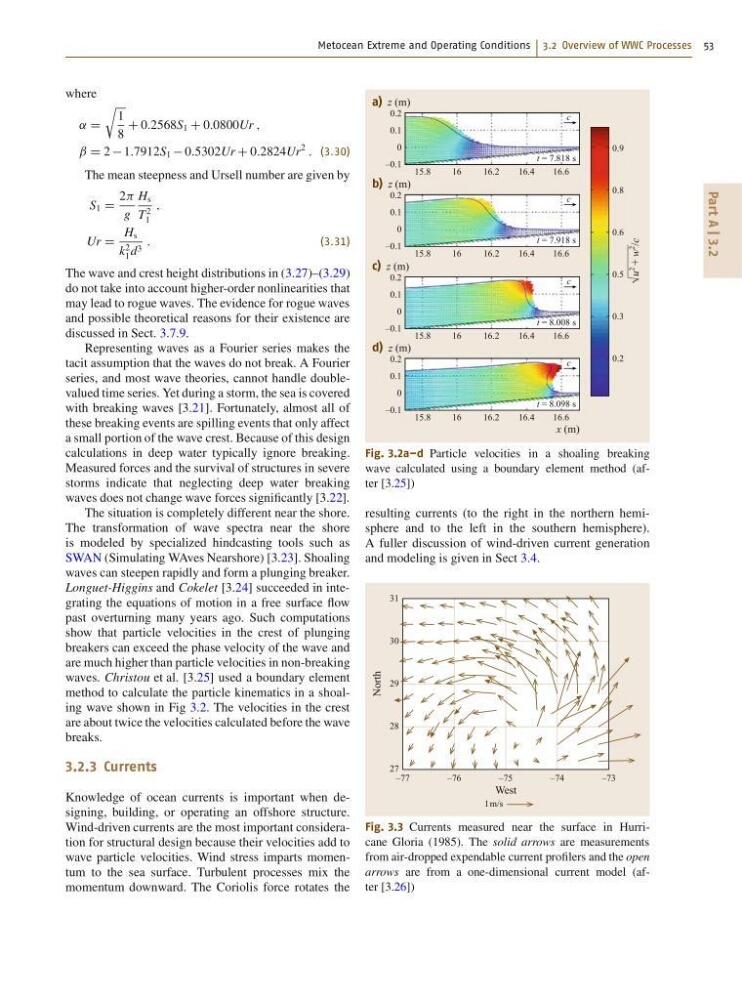
waves. Christou et al. [3.25] used a boundary element
method to calculate the particle kinematics in a shoaling wave shown in Fig 3.2. The velocities in the crest
are about twice the velocities calculated before the wave
breaks.
3.2.3 Currents
Knowledge of ocean currents is important when designing, building, or operating an offshore structure.
Wind-driven currents are the most important consideration for structural design because their velocities add to
wave particle velocities. Wind stress imparts momentum to the sea surface. Turbulent processes mix the
momentum downward. The Coriolis force rotates the
15.8
16
16.2
16.4
t = 7.818 s
16.6
c
a) z (m)
x (m)
0.2
0.1
0
–0.1
0.9
0.8
0.6
0.5
0.3
0.2
15.8
16
16.2
16.4
t = 7.918 s
16.6
c
b) z (m)
0.2
0.1
0
–0.1
15.8
16
16.2
16.4
t = 8.008 s
16.6
c
c) z (m)
0.2
0.1
0
–0.1
15.8
16
16.2
16.4
t = 8.098 s
16.6
√
———
u
2
+ w
2
/c
c
d) z (m)
0.2
0.1
0
–0.1
Fig. 3.2a–d Particle velocities in a shoaling breaking
wave calculated using a boundary element method (after [3.25])
resulting currents (to the right in the northern hemisphere and to the left in the southern hemisphere).
A fuller discussion of wind-driven current generation
and modeling is given in Sect 3.4.
–77
–76
–75
–74
–73
North
West
1 m/s
31
30
29
28
27
Fig. 3.3 Currents measured near the surface in Hurricane Gloria (1985). The solid arrows are measurements
from air-dropped expendable current profilers and the open
arrows are from a one-dimensional current model (after [3.26])
Part A | 3.2
where
˛ D
r
1
8
C 0:2568S 1 C 0:0800Ur ;
ˇ D 2 1:7912S 1 0:5302Ur C 0:2824Ur
2
: (3.30)
The mean steepness and Ursell number are given by
S 1 D
2
g
H s
T
2
1
;
Ur D
H s
k
2
1 d 3 :
(3.31)
The wave and crest height distributions in (3.27)–(3.29)
do not take into account higher-order nonlinearities that
may lead to rogue waves. The evidence for rogue waves
and possible theoretical reasons for their existence are
discussed in Sect. 3.7.9.
Representing waves as a Fourier series makes the
tacit assumption that the waves do not break. A Fourier
series, and most wave theories, cannot handle doublevalued time series. Yet during a storm, the sea is covered
with breaking waves [3.21]. Fortunately, almost all of
these breaking events are spilling events that only affect
a small portion of the wave crest. Because of this design
calculations in deep water typically ignore breaking.
Measured forces and the survival of structures in severe
storms indicate that neglecting deep water breaking
waves does not change wave forces significantly [3.22].
The situation is completely different near the shore.
The transformation of wave spectra near the shore
is modeled by specialized hindcasting tools such as
SWAN (Simulating WAves Nearshore) [3.23]. Shoaling
waves can steepen rapidly and form a plunging breaker.
Longuet-Higgins and Cokelet [3.24] succeeded in integrating the equations of motion in a free surface flow
past overturning many years ago. Such computations
show that particle velocities in the crest of plunging
breakers can exceed the phase velocity of the wave and
are much higher than particle velocities in non-breaking
waves. Christou et al. [3.25] used a boundary element
method to calculate the particle kinematics in a shoaling wave shown in Fig 3.2. The velocities in the crest
are about twice the velocities calculated before the wave
breaks.
3.2.3 Currents
Knowledge of ocean currents is important when designing, building, or operating an offshore structure.
Wind-driven currents are the most important consideration for structural design because their velocities add to
wave particle velocities. Wind stress imparts momentum to the sea surface. Turbulent processes mix the
momentum downward. The Coriolis force rotates the
15.8
16
16.2
16.4
t = 7.818 s
16.6
c
a) z (m)
x (m)
0.2
0.1
0
–0.1
0.9
0.8
0.6
0.5
0.3
0.2
15.8
16
16.2
16.4
t = 7.918 s
16.6
c
b) z (m)
0.2
0.1
0
–0.1
15.8
16
16.2
16.4
t = 8.008 s
16.6
c
c) z (m)
0.2
0.1
0
–0.1
15.8
16
16.2
16.4
t = 8.098 s
16.6
√
———
u
2
+ w
2
/c
c
d) z (m)
0.2
0.1
0
–0.1
Fig. 3.2a–d Particle velocities in a shoaling breaking
wave calculated using a boundary element method (after [3.25])
resulting currents (to the right in the northern hemisphere and to the left in the southern hemisphere).
A fuller discussion of wind-driven current generation
and modeling is given in Sect 3.4.
–77
–76
–75
–74
–73
North
West
1 m/s
31
30
29
28
27
Fig. 3.3 Currents measured near the surface in Hurricane Gloria (1985). The solid arrows are measurements
from air-dropped expendable current profilers and the open
arrows are from a one-dimensional current model (after [3.26])