

Part C | 28.2
616 Part C Coastal Design
imately 45
ı , the coastline evolution may become unstable: the maximum longshore transport rate occurs
at an angle of around 45
ı , so if the angle at a given
point is higher than that of its upstream neighbor, sand
will accumulate there until the maximum transport is
reached again. Ashton and Murray [28.14] elegantly
show through coastline modeling that this can explain
spectacular coastal shapes such as sand waves, flying
spits, and capes.
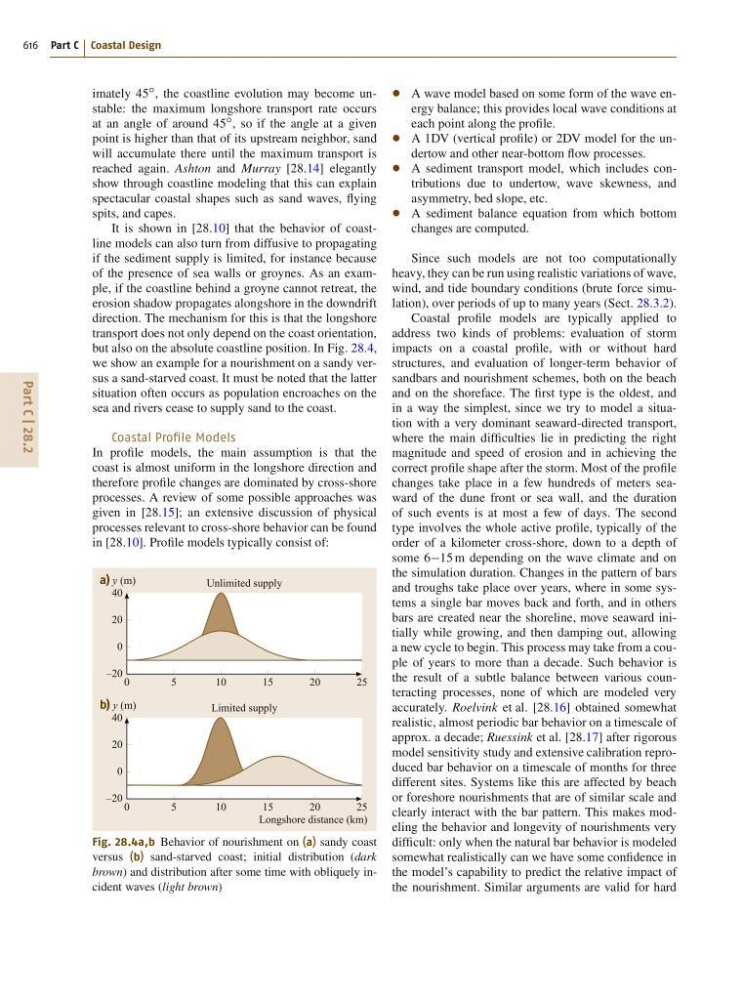
It is shown in [28.10] that the behavior of coastline models can also turn from diffusive to propagating
if the sediment supply is limited, for instance because
of the presence of sea walls or groynes. As an example, if the coastline behind a groyne cannot retreat, the
erosion shadow propagates alongshore in the downdrift
direction. The mechanism for this is that the longshore
transport does not only depend on the coast orientation,
but also on the absolute coastline position. In Fig. 28.4,
we show an example for a nourishment on a sandy versus a sand-starved coast. It must be noted that the latter
situation often occurs as population encroaches on the
sea and rivers cease to supply sand to the coast.
Coastal Profile Models
In profile models, the main assumption is that the
coast is almost uniform in the longshore direction and
therefore profile changes are dominated by cross-shore
processes. A review of some possible approaches was
given in [28.15]; an extensive discussion of physical
processes relevant to cross-shore behavior can be found
in [28.10]. Profile models typically consist of:
0
5
1 0
Unlimited supply
15
20
25
a) y (m)
Longshore distance (km)
40
20
0
–20
0
5
1 0
Limited supply
15
20
25
b) y (m)
40
20
0
–20
Fig. 28.4a,b Behavior of nourishment on (a) sandy coast
versus (b) sand-starved coast; initial distribution (dark
brown) and distribution after some time with obliquely incident waves (light brown)
A wave model based on some form of the wave energy balance; this provides local wave conditions at
each point along the profile.
A 1DV (vertical profile) or 2DV model for the undertow and other near-bottom flow processes.
A sediment transport model, which includes contributions due to undertow, wave skewness, and
asymmetry, bed slope, etc.
A sediment balance equation from which bottom
changes are computed.
Since such models are not too computationally
heavy, they can be run using realistic variations of wave,
wind, and tide boundary conditions (brute force simulation), over periods of up to many years (Sect. 28.3.2).
Coastal profile models are typically applied to
address two kinds of problems: evaluation of storm
impacts on a coastal profile, with or without hard
structures, and evaluation of longer-term behavior of
sandbars and nourishment schemes, both on the beach
and on the shoreface. The first type is the oldest, and
in a way the simplest, since we try to model a situation with a very dominant seaward-directed transport,
where the main difficulties lie in predicting the right
magnitude and speed of erosion and in achieving the
correct profile shape after the storm. Most of the profile
changes take place in a few hundreds of meters seaward of the dune front or sea wall, and the duration
of such events is at most a few of days. The second
type involves the whole active profile, typically of the
order of a kilometer cross-shore, down to a depth of
some 615 m depending on the wave climate and on
the simulation duration. Changes in the pattern of bars
and troughs take place over years, where in some systems a single bar moves back and forth, and in others
bars are created near the shoreline, move seaward initially while growing, and then damping out, allowing
a new cycle to begin. This process may take from a couple of years to more than a decade. Such behavior is
the result of a subtle balance between various counteracting processes, none of which are modeled very
accurately. Roelvink et al. [28.16] obtained somewhat
realistic, almost periodic bar behavior on a timescale of
approx. a decade; Ruessink et al. [28.17] after rigorous
model sensitivity study and extensive calibration reproduced bar behavior on a timescale of months for three
different sites. Systems like this are affected by beach
or foreshore nourishments that are of similar scale and
clearly interact with the bar pattern. This makes modeling the behavior and longevity of nourishments very
difficult: only when the natural bar behavior is modeled
somewhat realistically can we have some confidence in
the model’s capability to predict the relative impact of
the nourishment. Similar arguments are valid for hard