

Statistical Characterization of Hazards and Risk in Coastal Areas 26.A Appendix: Glossary of Probability and Risk Terms 591
Part C | 26.A
nored. Some of the common risk types that greatly
influence both how these risks are assessed, managed and communicated are defined below.
– Actual risk: A scientifically verifiable risk.
For example, it is well researched and documented that smoking places you at-risk for
cancer [26.3–6]. Actual risk is sometimes referred to as objective risk, but whether risk is
subjective or objective is related more to its
ability to be measured than it is to its actual verifiability.
– Perceived risk: Risk that is thought to exist by
an individual or group that is non-existent or exaggerated. This often occurs in situations where
the public is misinformed or in which media
reports instill unnecessary panic. Food safety
concerns often top the list of such events and
lead to the significant public policy debates, see,
for example, [26.7].
– Assumed risk: Risk that is taken by choice. Assumed risk can be quantifiably large or small,
and actual or perceived. For example, individuals who choose to partake in risky activities
(skydiving, mountain climbing) choose to assume the relatively large risks associated with
these activities, but choosing to drive a car, take
medicines or be involved in day-to-day activities all involve some assumed risk.
– Comparative risk: Risk placed in context
through comparison with another, perhaps better known risk. For example, stating that one
is more likely to be hit by a meteor than to be
injured in a plane crash compares a risk that people perceive as low (being hit by a meteor) with
one they perceive as high but which actually is
not. This helps place the risk in a conceptual
framework.
– Imposed risk: Risk that is forced upon an individual, either without the knowledge of the
individual or if known, without consent. For
example, second-hand smoke exposure is seen
as an imposed risk [26.8–10]. Natural events
such as earthquakes, hurricanes. and extreme
weather events are, to a large extent, imposed
risks, but to some extent individuals assume that
risk based on where they choose to live. For
an interesting approach to this, the reader is referred to the work of Parsad [26.11].
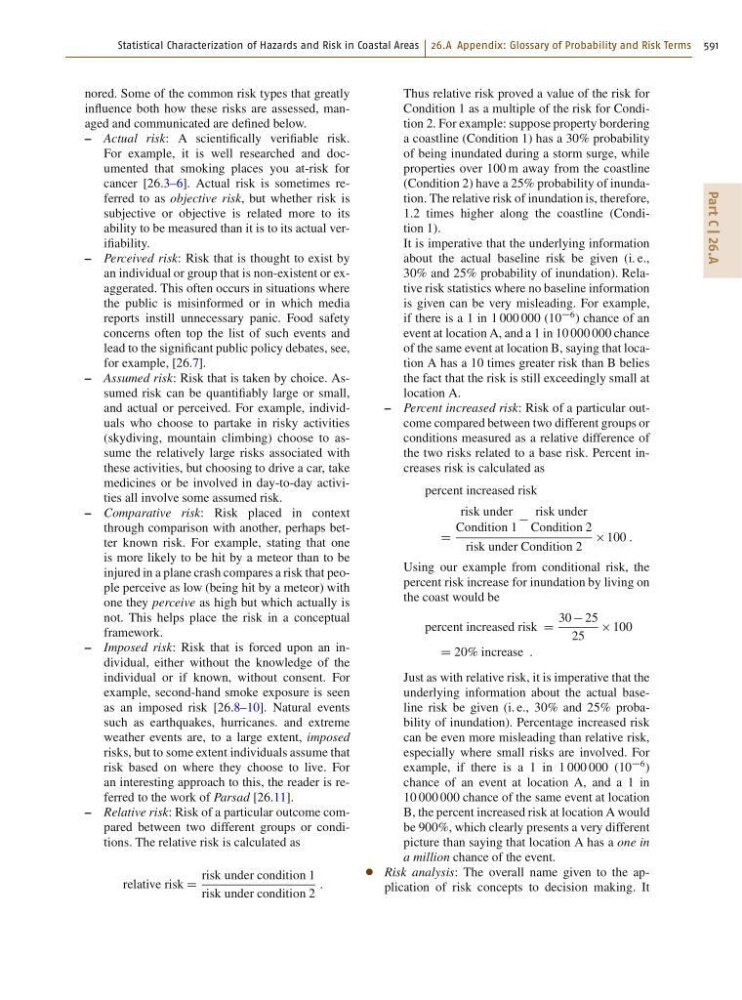
– Relative risk: Risk of a particular outcome compared between two different groups or conditions. The relative risk is calculated as
relative risk D
risk under condition 1
risk under condition 2
:
Thus relative risk proved a value of the risk for
Condition 1 as a multiple of the risk for Condition 2. For example: suppose property bordering
a coastline (Condition 1) has a 30% probability
of being inundated during a storm surge, while
properties over 100 m away from the coastline
(Condition 2) have a 25% probability of inundation. The relative risk of inundation is, therefore,
1.2 times higher along the coastline (Condition 1).
It is imperative that the underlying information
about the actual baseline risk be given (i. e.,
30% and 25% probability of inundation). Relative risk statistics where no baseline information
is given can be very misleading. For example,
if there is a 1 in 1 000 000 (10
6 ) chance of an
event at location A, and a 1 in 10 000 000 chance
of the same event at location B, saying that location A has a 10 times greater risk than B belies
the fact that the risk is still exceedingly small at
location A.
– Percent increased risk: Risk of a particular outcome compared between two different groups or
conditions measured as a relative difference of
the two risks related to a base risk. Percent increases risk is calculated as
percent increased risk
D
risk under
Condition 1
risk under
Condition 2
risk under Condition 2
100 :
Using our example from conditional risk, the
percent risk increase for inundation by living on
the coast would be
percent increased risk D
30 25
25
100
D 20% increase :
Just as with relative risk, it is imperative that the
underlying information about the actual baseline risk be given (i. e., 30% and 25% probability of inundation). Percentage increased risk
can be even more misleading than relative risk,
especially where small risks are involved. For
example, if there is a 1 in 1 000 000 (10
6 )
chance of an event at location A, and a 1 in
10 000 000 chance of the same event at location
B, the percent increased risk at location A would
be 900%, which clearly presents a very different
picture than saying that location A has a one in
a million chance of the event.
Risk analysis: The overall name given to the application of risk concepts to decision making. It