

Part C | 26.3
582 Part C Coastal Design
came the primary method used in many offshore designs [26.60] as well as in many coastal designs [26.61–
64]. Over time, it began to be evident that the selection of storms for hindcasts of waves and surges
often exhibited different CDF characteristics in different magnitude ranges. This led to the development of
Hurricane Katrina
–1
2
4
3
A
B
1
0
5
Surge height (m)
–ln{–ln [F(Surge height)]}
4
3.5
3
2.5
2
1.5
1
0.5
0
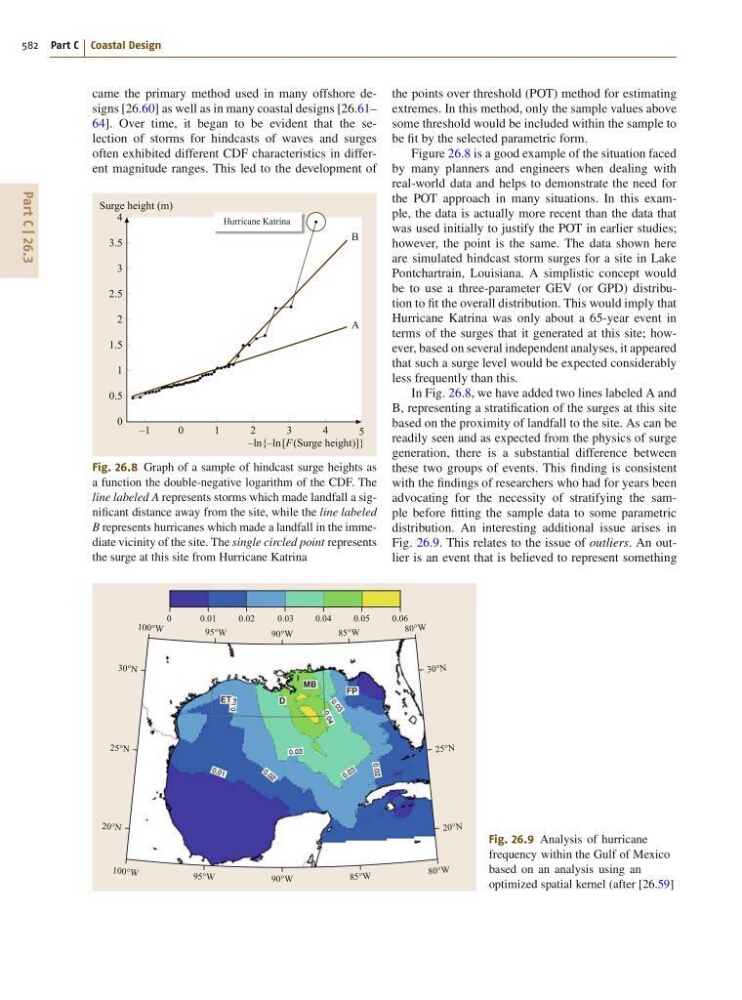
Fig. 26.8 Graph of a sample of hindcast surge heights as
a function the double-negative logarithm of the CDF. The
line labeled A represents storms which made landfall a significant distance away from the site, while the line labeled
B represents hurricanes which made a landfall in the immediate vicinity of the site. The single circled point represents
the surge at this site from Hurricane Katrina
90°W
85°W
95°W
90°W
85°W
80°W
30°N
25°N
20°N
80°W
95°W
100° W
30°N
25°N
20°N
100 °W
0.03
0.04
0.05
0.06
0.02
0.01
0
Fig. 26.9 Analysis of hurricane
frequency within the Gulf of Mexico
based on an analysis using an
optimized spatial kernel (after [26.59]
the points over threshold (POT) method for estimating
extremes. In this method, only the sample values above
some threshold would be included within the sample to
be fit by the selected parametric form.
Figure 26.8 is a good example of the situation faced
by many planners and engineers when dealing with
real-world data and helps to demonstrate the need for
the POT approach in many situations. In this example, the data is actually more recent than the data that
was used initially to justify the POT in earlier studies;
however, the point is the same. The data shown here
are simulated hindcast storm surges for a site in Lake
Pontchartrain, Louisiana. A simplistic concept would
be to use a three-parameter GEV (or GPD) distribution to fit the overall distribution. This would imply that
Hurricane Katrina was only about a 65-year event in
terms of the surges that it generated at this site; however, based on several independent analyses, it appeared
that such a surge level would be expected considerably
less frequently than this.
In Fig. 26.8, we have added two lines labeled A and
B, representing a stratification of the surges at this site
based on the proximity of landfall to the site. As can be
readily seen and as expected from the physics of surge
generation, there is a substantial difference between
these two groups of events. This finding is consistent
with the findings of researchers who had for years been
advocating for the necessity of stratifying the sample before fitting the sample data to some parametric
distribution. An interesting additional issue arises in
Fig. 26.9. This relates to the issue of outliers. An outlier is an event that is believed to represent something