

Statistical Characterization of Hazards and Risk in Coastal Areas 26.3 Historical Perspective 577
Part C | 26.3
higher surges there, consistent with results produced by
idealized simulations. Additionally, storm approach direction can be important even along straight coastlines
but can become exceptionally important on coasts with
irregular shapes.
This particular example also affords a good opportunity to examine problems related to overly simplistic
representations of the physics of processes in hazard/risk analyses. In the 1950s, the state of the art
in surge prediction was quite crude and assumed that
inland surges could be estimated via a two-step procedure, with the first step producing an estimate of the
wind-driven surge levels at the coastline (neglecting the
contributions of wave setup to these water levels) and
the second step using hydrologic flow models to convey
the water inland (neglecting both wind and wave contributions to inland surge levels). Subsequently, many
studies demonstrated the need to estimate inundation
in inland areas by including the effects of winds, topography, precipitation, and river discharge within an
area [26.41–44]. Wind–wave contributions to coastal
flooding have also been shown to be very significant in
areas where the nearshore slope is high [26.41]. Based
on all these studies, two primary results should be recognized. First, it is not possible to utilize a single factor
to characterize waves and flooding in coastal and nearcoast areas; and second, the older paradigm in which
water levels were first estimated at the coast, using
equations appropriate for surge prediction, and then allowed to propagate inland, using equations appropriate
for hydrologic flow modeling, is inconsistent with today’s state of the art.
There is an obvious analog between good computational models (Chap. 26) and good measurements in
the estimation of extremes. No one would trust a design based on measurements known to have deficiencies
leading to potentially large biases and random errors.
In a similar vein, it is essential to obtain reliable, unbiased estimates from models of winds, waves, and surges
for applications to hazard/risk assessment. Only after
a modeling system is shown to be capable of generating accurate estimates is it worth expending the huge
resources necessary to execute the number of computational simulations in such a system that would be
required to provide reliable estimates of extremes.
26.3.2 The Development
of Probabilistic Methods
During the latter half of the twentieth century two factors began to emerge which combined to allow significant progress in our capabilities for estimating coastal
extremes: an improved theoretical foundation for the estimation of extremes and significantly increased quan10
20
30
Simulation range
40
50
60
70
R max (km)
Δp (mb)
1
2
3
4
5
6
7
8
Peak surge (m)
130
120
110
100
90
80
70
60
50
40
Simulated
Oct 1941 (unnamed)
Oct 1944 (unnamed)
Jun 1957 (Audrey)
Sep 1961 (Carla)
Sep 1964 (Hilda)
Aug 1965 (Betsy)
Sep 1967 (Beulah)
Aug 1969 (Camille)
Jul 1970 (Celia)
Aug 1974 (Carmen)
Aug 1979 (Frederic)
Jul 1980 (Allen)
Aug 1992 (Andrew)
Oct 1995 (Opal)
Aug 1999 (Bret)
Sep 2002 (Lili)
Sep 2004 (Charley)
Sep 2004 (Ivan)
Jul 2005 (Dennis)
Aug 2005 (Katrina)
Sep 2005 (Rita)
Oct 2005 (Wilma)
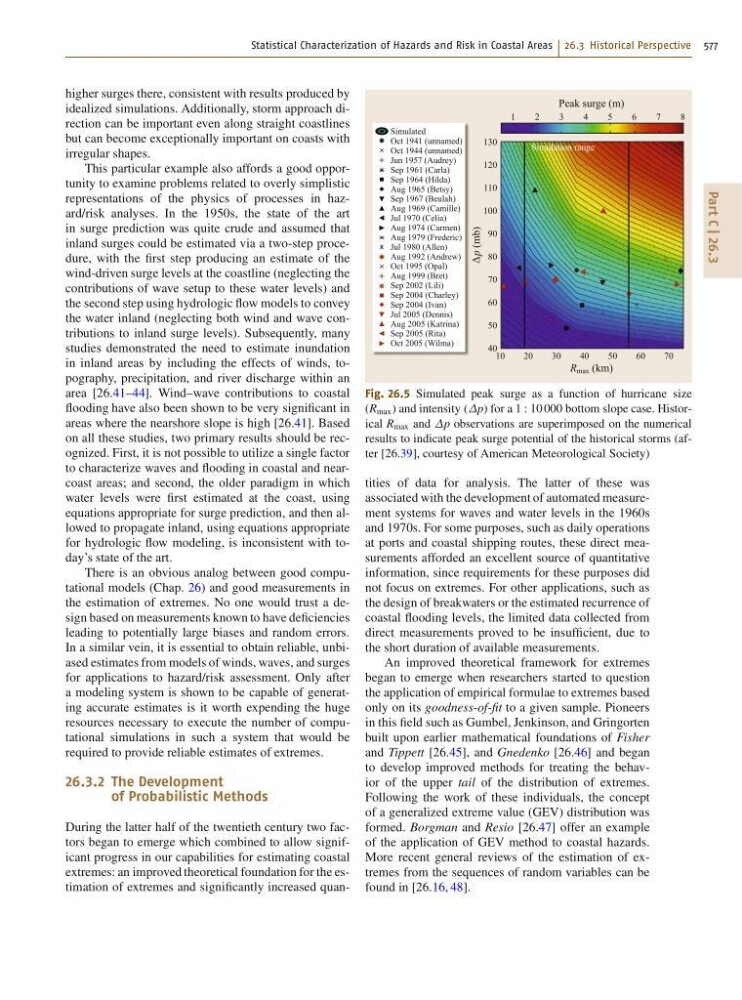
Fig. 26.5 Simulated peak surge as a function of hurricane size
(R max ) and intensity (p) for a 1 W 10 000 bottom slope case. Historical R max and p observations are superimposed on the numerical
results to indicate peak surge potential of the historical storms (after [26.39], courtesy of American Meteorological Society)
tities of data for analysis. The latter of these was
associated with the development of automated measurement systems for waves and water levels in the 1960s
and 1970s. For some purposes, such as daily operations
at ports and coastal shipping routes, these direct measurements afforded an excellent source of quantitative
information, since requirements for these purposes did
not focus on extremes. For other applications, such as
the design of breakwaters or the estimated recurrence of
coastal flooding levels, the limited data collected from
direct measurements proved to be insufficient, due to
the short duration of available measurements.
An improved theoretical framework for extremes
began to emerge when researchers started to question
the application of empirical formulae to extremes based
only on its goodness-of-fit to a given sample. Pioneers
in this field such as Gumbel, Jenkinson, and Gringorten
built upon earlier mathematical foundations of Fisher
and Tippett [26.45], and Gnedenko [26.46] and began
to develop improved methods for treating the behavior of the upper tail of the distribution of extremes.
Following the work of these individuals, the concept
of a generalized extreme value (GEV) distribution was
formed. Borgman and Resio [26.47] offer an example
of the application of GEV method to coastal hazards.
More recent general reviews of the estimation of extremes from the sequences of random variables can be
found in [26.16, 48].