

Physical Characteristics of Coastal Hazards 25.2 Coastal Impacts 559
Part C | 25.2
While Hurricane Camille was by far the more intense
of the two, Hurricane Katrina’s storm surge at 8:5 m
was significantly larger than Camille’s 6:9 m. The reason Hurricane Katrina generated such high surges was
because of the large extent of hurricane-force winds,
more than twice that for Hurricane Camille. It is now
well accepted that tropical cyclone surge magnitude
is primarily influenced by the regional bathymetric
slope and the storm’s intensity and size [25.89, 91–93],
while the cyclone’s forward speed and track orientation with respect to the coastline are generally less
influential [25.85, 94, 95]. Irish and Resio [25.88] proposed a quasi-empirical model for estimating maximum
tropical cyclone surge (excluding astronomical tide) on
continuous coasts
storm-max Š
n
.p far p c /
p atm
X shelf-30
 R 33
X shelf-30
Ã
C q ; (25.16a)
 R 33
X shelf-30
Ã
D
8
ˆ ˆ <
ˆ ˆ :
 R 33
X shelf-30
Ã
when
 R 33
X shelf-30
Ã
Ä 1 ;
1
w h e n
 R 33
X shelf-30
Ã
> 1 ;
(25.16b)
where n and q are empirical fit coefficients, p atm is
standard atmospheric pressure, R 33 is the storm radius
to U a D 33 m s
1 (hurricane-force winds), and X shelf-30
is cross-shore distance from the shoreline to the 30 m
depth contour. Based on the observations from continental US hurricane strikes between 1941 and 2008,
Irish and Resio [25.88] determined n D 4:51 10
4 and
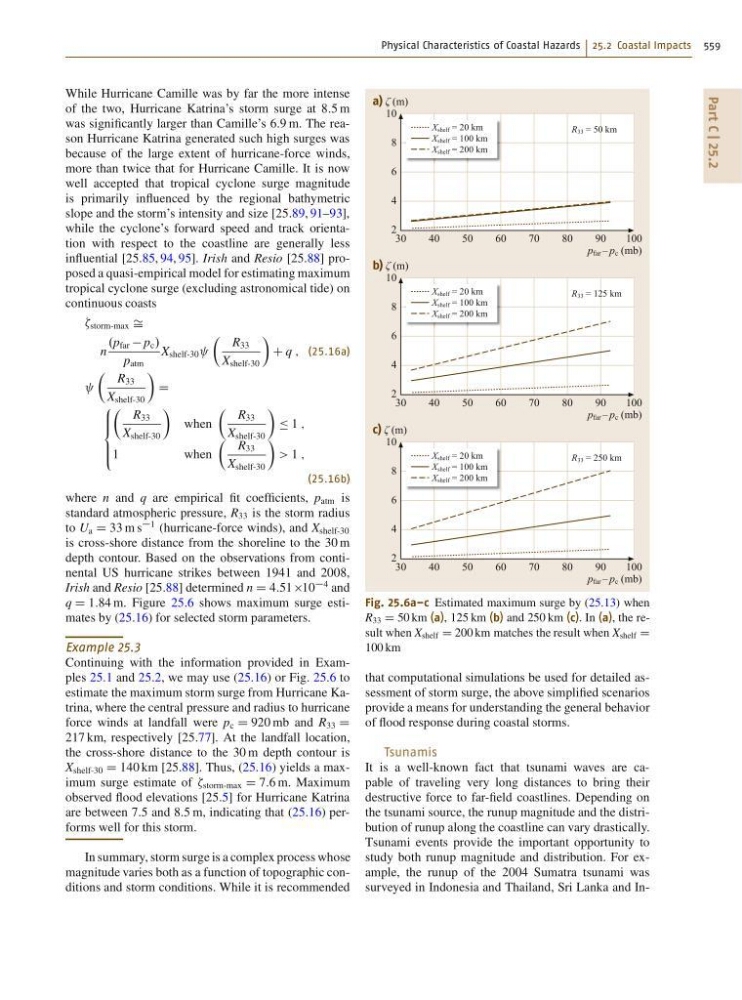
q D 1:84 m. Figure 25.6 shows maximum surge estimates by (25.16) for selected storm parameters.
Example 25.3
Continuing with the information provided in Examples 25.1 and 25.2, we may use (25.16) or Fig. 25.6 to
estimate the maximum storm surge from Hurricane Katrina, where the central pressure and radius to hurricane
force winds at landfall were p c D 920 mb and R 33 D
217 km, respectively [25.77]. At the landfall location,
the cross-shore distance to the 30 m depth contour is
X shelf-30 D 140 km [25.88]. Thus, (25.16) yields a maximum surge estimate of storm-max D 7:6 m. Maximum
observed flood elevations [25.5] for Hurricane Katrina
are between 7.5 and 8:5 m, indicating that (25.16) performs well for this storm.
In summary, storm surge is a complex process whose
magnitude varies both as a function of topographic conditions and storm conditions. While it is recommended
X shelf = 20 km
X shelf = 100 km
X shelf = 200 km
R 33 = 50 km
R 33 = 125 km
R 33 = 250 km
X shelf = 20 km
X shelf = 100 km
X shelf = 200 km
X shelf = 20 km
X shelf = 100 km
X shelf = 200 km
30
40
50
60
70
80
90
100
a) ζ (m)
p far – p c (mb)
10
8
6
4
2
30
40
50
60
70
80
90
100
b) ζ (m)
p far – p c (mb)
10
8
6
4
2
30
40
50
60
70
80
90
100
c) ζ (m)
p far – p c (mb)
10
8
6
4
2
Fig. 25.6a–c Estimated maximum surge by (25.13) when
R 33 D 50 km (a), 125 km (b) and 250 km (c). In (a), the result when X shelf D 200 km matches the result when X shelf D
100 km
that computational simulations be used for detailed assessment of storm surge, the above simplified scenarios
provide a means for understanding the general behavior
of flood response during coastal storms.
Tsunamis
It is a well-known fact that tsunami waves are capable of traveling very long distances to bring their
destructive force to far-field coastlines. Depending on
the tsunami source, the runup magnitude and the distribution of runup along the coastline can vary drastically.
Tsunami events provide the important opportunity to
study both runup magnitude and distribution. For example, the runup of the 2004 Sumatra tsunami was
surveyed in Indonesia and Thailand, Sri Lanka and In-