

Part B | 24.5
538 Part B Autonomous Ocean Vehicles, Subsystems and Control
Open water
Coastal
Sea ice
Ice shelf
395_1_1
402_1_5
402_2_5
385_1_1
415_1_3
1
2
3
4
5
a) Average of the relative frequency
Weight
0.4
0.35
0.3
0.25
0.2
0.15
0.1
0.05
0
Open water Coastal waters Sea ice
Ice shelf
b) P (loss/fault)
Operational environment
0.9
0.8
0.7
0.6
0.5
0.4
0.3
0.2
0.1
0
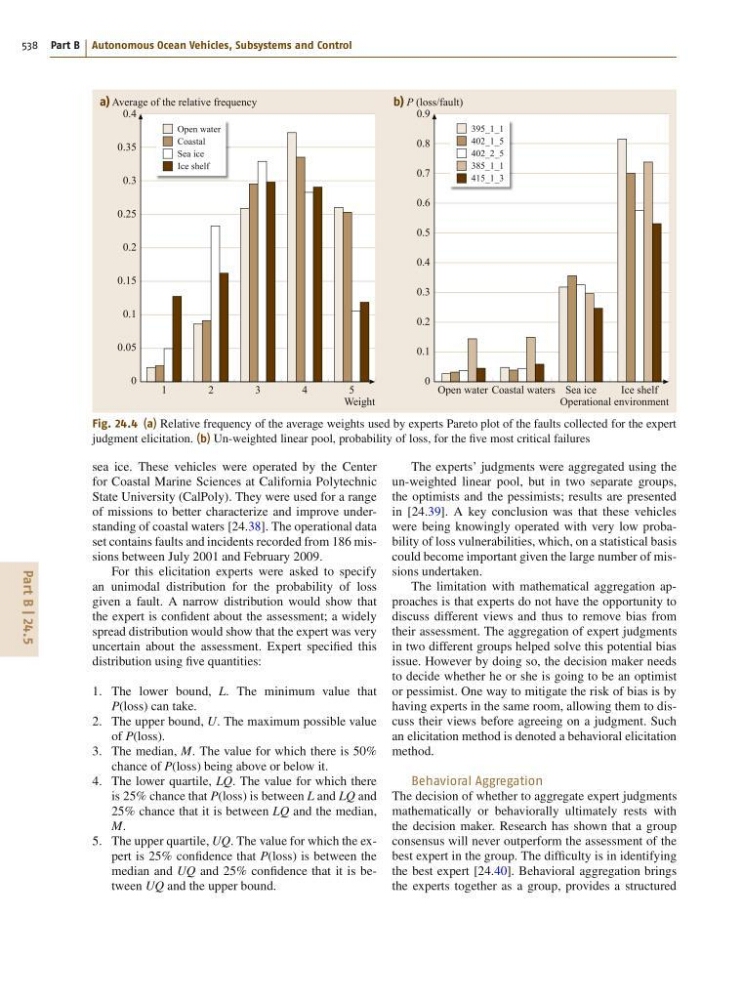
Fig. 24.4 (a) Relative frequency of the average weights used by experts Pareto plot of the faults collected for the expert
judgment elicitation. (b) Un-weighted linear pool, probability of loss, for the five most critical failures
sea ice. These vehicles were operated by the Center
for Coastal Marine Sciences at California Polytechnic
State University (CalPoly). They were used for a range
of missions to better characterize and improve understanding of coastal waters [24.38]. The operational data
set contains faults and incidents recorded from 186 missions between July 2001 and February 2009.
For this elicitation experts were asked to specify
an unimodal distribution for the probability of loss
given a fault. A narrow distribution would show that
the expert is confident about the assessment; a widely
spread distribution would show that the expert was very
uncertain about the assessment. Expert specified this
distribution using five quantities:
1. The lower bound, L. The minimum value that
P(loss) can take.
2. The upper bound, U. The maximum possible value
of P(loss).
3. The median, M. The value for which there is 50%
chance of P(loss) being above or below it.
4. The lower quartile, LQ. The value for which there
is 25% chance that P(loss) is between L and LQ and
25% chance that it is between LQ and the median,
M.
5. The upper quartile, UQ. The value for which the expert is 25% confidence that P(loss) is between the
median and UQ and 25% confidence that it is between UQ and the upper bound.
The experts’ judgments were aggregated using the
un-weighted linear pool, but in two separate groups,
the optimists and the pessimists; results are presented
in [24.39]. A key conclusion was that these vehicles
were being knowingly operated with very low probability of loss vulnerabilities, which, on a statistical basis
could become important given the large number of missions undertaken.
The limitation with mathematical aggregation approaches is that experts do not have the opportunity to
discuss different views and thus to remove bias from
their assessment. The aggregation of expert judgments
in two different groups helped solve this potential bias
issue. However by doing so, the decision maker needs
to decide whether he or she is going to be an optimist
or pessimist. One way to mitigate the risk of bias is by
having experts in the same room, allowing them to discuss their views before agreeing on a judgment. Such
an elicitation method is denoted a behavioral elicitation
method.
Behavioral Aggregation
The decision of whether to aggregate expert judgments
mathematically or behaviorally ultimately rests with
the decision maker. Research has shown that a group
consensus will never outperform the assessment of the
best expert in the group. The difficulty is in identifying
the best expert [24.40]. Behavioral aggregation brings
the experts together as a group, provides a structured