

Elements of Physical Oceanography 2.4 Surface Gravity Waves 19
Part A | 2.4
–2 –1
Surface
waves
Inertial
motions
Tides
Gulf stream
varibility
Semidermal tides
Gulf stream
variability
planetary
values
Dermal tides
Capillary
waves
Gravity waves
Interior
circulation
Wind driven
circulation
Major
currents
Major
currents
Storm tides
Tsunamis
Turbulance
Inertial waves
Short
Long
Capillary
0 1 2 3 4
hour
day
month
year
5 6 7 8 9 10 11
a) Log 10 E (cm
2
/s
3
/Hz)
Log 10 (period) T (s)
13
12
11
10
9
8
7
6
5
4
3
2
1
0
–1
–2
–2 –1 0 1 2 3 4 5 6 7 8 9 10
b) E/T (cp£
2
/s
2
)
Log 10 T
4×10
3
3×10
3
2×10
3
10
3
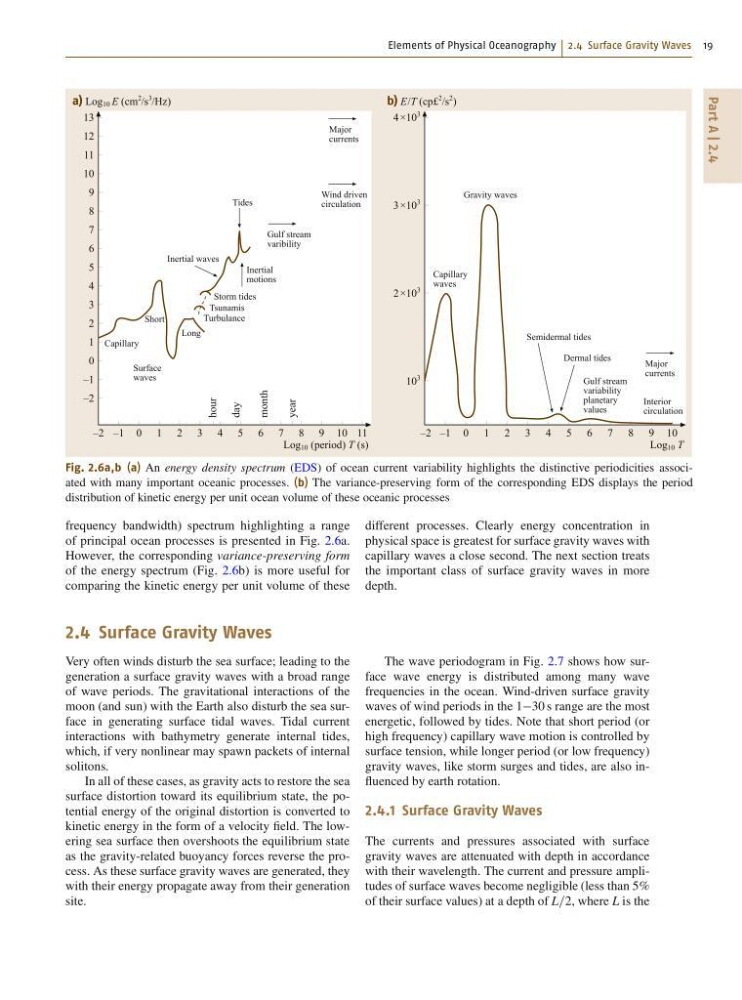
Fig. 2.6a,b (a) An energy density spectrum (EDS) of ocean current variability highlights the distinctive periodicities associated with many important oceanic processes. (b) The variance-preserving form of the corresponding EDS displays the period
distribution of kinetic energy per unit ocean volume of these oceanic processes
frequency bandwidth) spectrum highlighting a range
of principal ocean processes is presented in Fig. 2.6a.
However, the corresponding variance-preserving form
of the energy spectrum (Fig. 2.6b) is more useful for
comparing the kinetic energy per unit volume of these
different processes. Clearly energy concentration in
physical space is greatest for surface gravity waves with
capillary waves a close second. The next section treats
the important class of surface gravity waves in more
depth.
2.4 Surface Gravity Waves
Very often winds disturb the sea surface; leading to the
generation a surface gravity waves with a broad range
of wave periods. The gravitational interactions of the
moon (and sun) with the Earth also disturb the sea surface in generating surface tidal waves. Tidal current
interactions with bathymetry generate internal tides,
which, if very nonlinear may spawn packets of internal
solitons.
In all of these cases, as gravity acts to restore the sea
surface distortion toward its equilibrium state, the potential energy of the original distortion is converted to
kinetic energy in the form of a velocity field. The lowering sea surface then overshoots the equilibrium state
as the gravity-related buoyancy forces reverse the process. As these surface gravity waves are generated, they
with their energy propagate away from their generation
site.
The wave periodogram in Fig. 2.7 shows how surface wave energy is distributed among many wave
frequencies in the ocean. Wind-driven surface gravity
waves of wind periods in the 130 s range are the most
energetic, followed by tides. Note that short period (or
high frequency) capillary wave motion is controlled by
surface tension, while longer period (or low frequency)
gravity waves, like storm surges and tides, are also influenced by earth rotation.
2.4.1 Surface Gravity Waves
The currents and pressures associated with surface
gravity waves are attenuated with depth in accordance
with their wavelength. The current and pressure amplitudes of surface waves become negligible (less than 5%
of their surface values) at a depth of L=2, where L is the
Part A | 2.4
–2 –1
Surface
waves
Inertial
motions
Tides
Gulf stream
varibility
Semidermal tides
Gulf stream
variability
planetary
values
Dermal tides
Capillary
waves
Gravity waves
Interior
circulation
Wind driven
circulation
Major
currents
Major
currents
Storm tides
Tsunamis
Turbulance
Inertial waves
Short
Long
Capillary
0 1 2 3 4
hour
day
month
year
5 6 7 8 9 10 11
a) Log 10 E (cm
2
/s
3
/Hz)
Log 10 (period) T (s)
13
12
11
10
9
8
7
6
5
4
3
2
1
0
–1
–2
–2 –1 0 1 2 3 4 5 6 7 8 9 10
b) E/T (cp£
2
/s
2
)
Log 10 T
4×10
3
3×10
3
2×10
3
10
3
Fig. 2.6a,b (a) An energy density spectrum (EDS) of ocean current variability highlights the distinctive periodicities associated with many important oceanic processes. (b) The variance-preserving form of the corresponding EDS displays the period
distribution of kinetic energy per unit ocean volume of these oceanic processes
frequency bandwidth) spectrum highlighting a range
of principal ocean processes is presented in Fig. 2.6a.
However, the corresponding variance-preserving form
of the energy spectrum (Fig. 2.6b) is more useful for
comparing the kinetic energy per unit volume of these
different processes. Clearly energy concentration in
physical space is greatest for surface gravity waves with
capillary waves a close second. The next section treats
the important class of surface gravity waves in more
depth.
2.4 Surface Gravity Waves
Very often winds disturb the sea surface; leading to the
generation a surface gravity waves with a broad range
of wave periods. The gravitational interactions of the
moon (and sun) with the Earth also disturb the sea surface in generating surface tidal waves. Tidal current
interactions with bathymetry generate internal tides,
which, if very nonlinear may spawn packets of internal
solitons.
In all of these cases, as gravity acts to restore the sea
surface distortion toward its equilibrium state, the potential energy of the original distortion is converted to
kinetic energy in the form of a velocity field. The lowering sea surface then overshoots the equilibrium state
as the gravity-related buoyancy forces reverse the process. As these surface gravity waves are generated, they
with their energy propagate away from their generation
site.
The wave periodogram in Fig. 2.7 shows how surface wave energy is distributed among many wave
frequencies in the ocean. Wind-driven surface gravity
waves of wind periods in the 130 s range are the most
energetic, followed by tides. Note that short period (or
high frequency) capillary wave motion is controlled by
surface tension, while longer period (or low frequency)
gravity waves, like storm surges and tides, are also influenced by earth rotation.
2.4.1 Surface Gravity Waves
The currents and pressures associated with surface
gravity waves are attenuated with depth in accordance
with their wavelength. The current and pressure amplitudes of surface waves become negligible (less than 5%
of their surface values) at a depth of L=2, where L is the