

Hydromechanics 7.3 Hydrodynamics 173
Part A | 7.3
nondimensional viscous wall units, using the friction
velocity u D .. w ==/
1=2 , where w is the shear stress
at the boundary and is the fluid density, to scale the
velocity and u == to scale length. The distance normal
to the boundary is then expressed as y
C
D yu == and
the velocity in the boundary layer as u
C
D u=u . The
velocity and length scales in the outer region are, respectively, the freestream speed U e , and the boundary
layer thickness ı. Dimensional analysis and use of the
overlap region suggest that the mean speeds in the inner
and outer layers, respectively, are approximately given
by
U
C
D
8
<
:
y
C
for y
C
. 5
1
Ä
ln y
C
C B
1
Ä
ln .1 C 0:3k
C
/ for y
C
& 30
;
(7.92)
and
U
C
e U
C
D D
1
Ä
ln
y
ı
C A
 ı
w
dp e
dx
Ã
;
(7.93)
where dp e =dx is the pressure gradient in the flow and
k is average height of surface roughness [7.16]. Experimental results suggest Ä 0:41 and B 5. The
logarithmic dependence of the velocity in the inner
layer is known as the law of the wall, while the outer
flow dependence on U
C
e and ı is known as the law of
the wake.
Unlike boundary layer flows, free-stream turbulence
generated through the breakdown of shear layers, wakes
or jets is characterized by the maximum velocity U max
and the width of the shear layer, b.x/, where x is the
downstream distance.
Turbulent Flow in a Circular Pipe. The flow in a pipe
is fully turbulent when the Reynolds number based on
the pipe diameter is Re D > 3000. The distribution of the
mean velocity in the pipe can be represented by the law
of the wall across the entire pipe cross-section, the wake
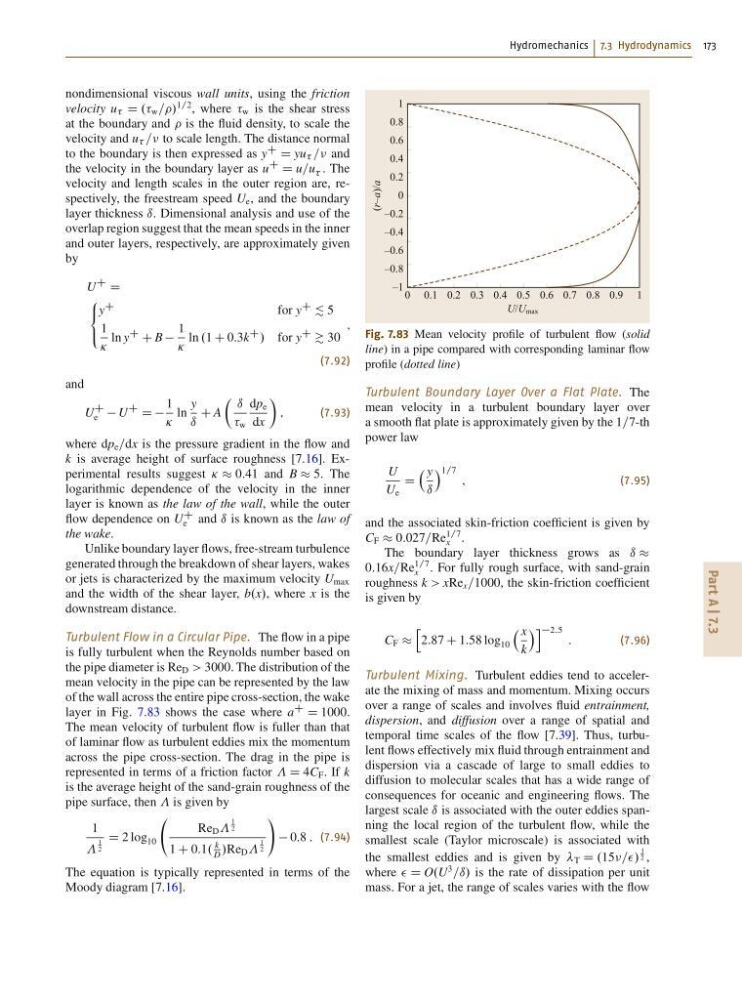
layer in Fig. 7.83 shows the case where a
C
D 1000.
The mean velocity of turbulent flow is fuller than that
of laminar flow as turbulent eddies mix the momentum
across the pipe cross-section. The drag in the pipe is
represented in terms of a friction factor D 4C F . If k
is the average height of the sand-grain roughness of the
pipe surface, then is given by
1
1
2
D 2 log 10
Re D
1
2
1 C 0:1.
k
D
/Re D
1
2
!
0:8 : (7.94)
The equation is typically represented in terms of the
Moody diagram [7.16].
0 0.1 0.2 0.3 0.4 0.5 0.6 0.7 0.8 0.9 1
(r–a)/a
U/U max
1
0.8
0.6
0.4
0.2
0
–0.2
–0.4
–0.6
–0.8
–1
Fig. 7.83 Mean velocity profile of turbulent flow (solid
line) in a pipe compared with corresponding laminar flow
profile (dotted line)
Turbulent Boundary Layer Over a Flat Plate. The
mean velocity in a turbulent boundary layer over
a smooth flat plate is approximately given by the 1=7-th
power law
U
U e
D
y
ı
Á 1=7 ;
(7.95)
and the associated skin-friction coefficient is given by
C F 0:027=Re
1=7
x .
The boundary layer thickness grows as ı
0:16x=Re
1=7
x . For fully rough surface, with sand-grain
roughness k > xRe x =1000, the skin-friction coefficient
is given by
C F
h
2:87 C 1:58 log 10
x
k
Ái 2:5 :
(7.96)
Turbulent Mixing. Turbulent eddies tend to accelerate the mixing of mass and momentum. Mixing occurs
over a range of scales and involves fluid entrainment,
dispersion, and diffusion over a range of spatial and
temporal time scales of the flow [7.39]. Thus, turbulent flows effectively mix fluid through entrainment and
dispersion via a cascade of large to small eddies to
diffusion to molecular scales that has a wide range of
consequences for oceanic and engineering flows. The
largest scale ı is associated with the outer eddies spanning the local region of the turbulent flow, while the
smallest scale (Taylor microscale) is associated with
the smallest eddies and is given by T D .15==/
1
2 ,
where D O.U
3
=ı/ is the rate of dissipation per unit
mass. For a jet, the range of scales varies with the flow
Part A | 7.3
nondimensional viscous wall units, using the friction
velocity u D .. w ==/
1=2 , where w is the shear stress
at the boundary and is the fluid density, to scale the
velocity and u == to scale length. The distance normal
to the boundary is then expressed as y
C
D yu == and
the velocity in the boundary layer as u
C
D u=u . The
velocity and length scales in the outer region are, respectively, the freestream speed U e , and the boundary
layer thickness ı. Dimensional analysis and use of the
overlap region suggest that the mean speeds in the inner
and outer layers, respectively, are approximately given
by
U
C
D
8
<
:
y
C
for y
C
. 5
1
Ä
ln y
C
C B
1
Ä
ln .1 C 0:3k
C
/ for y
C
& 30
;
(7.92)
and
U
C
e U
C
D D
1
Ä
ln
y
ı
C A
 ı
w
dp e
dx
Ã
;
(7.93)
where dp e =dx is the pressure gradient in the flow and
k is average height of surface roughness [7.16]. Experimental results suggest Ä 0:41 and B 5. The
logarithmic dependence of the velocity in the inner
layer is known as the law of the wall, while the outer
flow dependence on U
C
e and ı is known as the law of
the wake.
Unlike boundary layer flows, free-stream turbulence
generated through the breakdown of shear layers, wakes
or jets is characterized by the maximum velocity U max
and the width of the shear layer, b.x/, where x is the
downstream distance.
Turbulent Flow in a Circular Pipe. The flow in a pipe
is fully turbulent when the Reynolds number based on
the pipe diameter is Re D > 3000. The distribution of the
mean velocity in the pipe can be represented by the law
of the wall across the entire pipe cross-section, the wake
layer in Fig. 7.83 shows the case where a
C
D 1000.
The mean velocity of turbulent flow is fuller than that
of laminar flow as turbulent eddies mix the momentum
across the pipe cross-section. The drag in the pipe is
represented in terms of a friction factor D 4C F . If k
is the average height of the sand-grain roughness of the
pipe surface, then is given by
1
1
2
D 2 log 10
Re D
1
2
1 C 0:1.
k
D
/Re D
1
2
!
0:8 : (7.94)
The equation is typically represented in terms of the
Moody diagram [7.16].
0 0.1 0.2 0.3 0.4 0.5 0.6 0.7 0.8 0.9 1
(r–a)/a
U/U max
1
0.8
0.6
0.4
0.2
0
–0.2
–0.4
–0.6
–0.8
–1
Fig. 7.83 Mean velocity profile of turbulent flow (solid
line) in a pipe compared with corresponding laminar flow
profile (dotted line)
Turbulent Boundary Layer Over a Flat Plate. The
mean velocity in a turbulent boundary layer over
a smooth flat plate is approximately given by the 1=7-th
power law
U
U e
D
y
ı
Á 1=7 ;
(7.95)
and the associated skin-friction coefficient is given by
C F 0:027=Re
1=7
x .
The boundary layer thickness grows as ı
0:16x=Re
1=7
x . For fully rough surface, with sand-grain
roughness k > xRe x =1000, the skin-friction coefficient
is given by
C F
h
2:87 C 1:58 log 10
x
k
Ái 2:5 :
(7.96)
Turbulent Mixing. Turbulent eddies tend to accelerate the mixing of mass and momentum. Mixing occurs
over a range of scales and involves fluid entrainment,
dispersion, and diffusion over a range of spatial and
temporal time scales of the flow [7.39]. Thus, turbulent flows effectively mix fluid through entrainment and
dispersion via a cascade of large to small eddies to
diffusion to molecular scales that has a wide range of
consequences for oceanic and engineering flows. The
largest scale ı is associated with the outer eddies spanning the local region of the turbulent flow, while the
smallest scale (Taylor microscale) is associated with
the smallest eddies and is given by T D .15==/
1
2 ,
where D O.U
3
=ı/ is the rate of dissipation per unit
mass. For a jet, the range of scales varies with the flow