

Part A | 6.6
120 Part A Fundamentals
ture of the defects in a metallic crystal structure but
somewhat later it is influenced also by the cessation
in the growth of some pits (meta stable pits) in favor
of others [6.41]. This can be considered to influence
subsequent pit growth and the development of pitting,
and giving the appearance of randomness also for later
pitting. However, studies of the correlation structure of
larger corroded surfaces show a high degree of uniformity in pit depth with only a small proportion of greater
depth than the remainder [6.42]. Although this finding
tends to undermine statistical analyses (such as those
based on extreme value theory) that are based on each
pit depth being independent from all other pit depths, it
0.5 years
1
4
0
0.5
Probability of
exceedence
= 1– φ (x)
Gumbel distribution
fitted to maximum pit depth data
mild steel, Taylors Beach
1
1.5
2
Gumbel distribution standardised variable w
Cumulative probability
φ (x)
Maximum pit depth (mm)
3
2
1
0
–1
–2
0.95
0.9
0.8
0.7
0.6
0.5
0.4
0.3
0.2
0.1
0.05
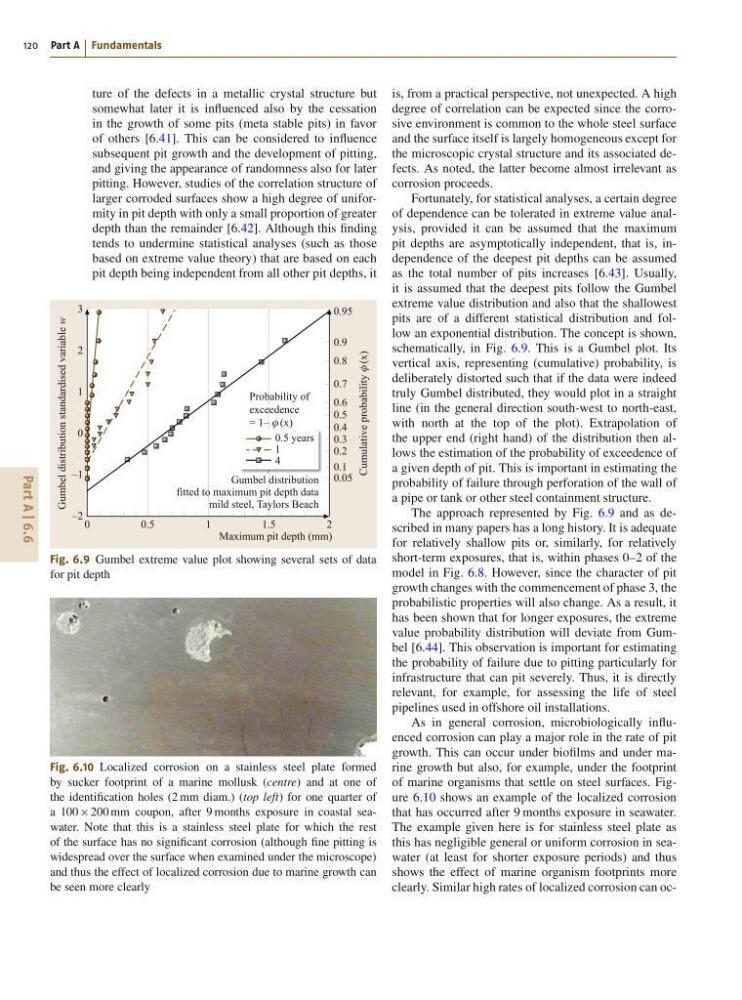
Fig. 6.9 Gumbel extreme value plot showing several sets of data
for pit depth
Fig. 6.10 Localized corrosion on a stainless steel plate formed
by sucker footprint of a marine mollusk (centre) and at one of
the identification holes (2 mm diam.) (top left) for one quarter of
a 100 200 mm coupon, after 9 months exposure in coastal seawater. Note that this is a stainless steel plate for which the rest
of the surface has no significant corrosion (although fine pitting is
widespread over the surface when examined under the microscope)
and thus the effect of localized corrosion due to marine growth can
be seen more clearly
is, from a practical perspective, not unexpected. A high
degree of correlation can be expected since the corrosive environment is common to the whole steel surface
and the surface itself is largely homogeneous except for
the microscopic crystal structure and its associated defects. As noted, the latter become almost irrelevant as
corrosion proceeds.
Fortunately, for statistical analyses, a certain degree
of dependence can be tolerated in extreme value analysis, provided it can be assumed that the maximum
pit depths are asymptotically independent, that is, independence of the deepest pit depths can be assumed
as the total number of pits increases [6.43]. Usually,
it is assumed that the deepest pits follow the Gumbel
extreme value distribution and also that the shallowest
pits are of a different statistical distribution and follow an exponential distribution. The concept is shown,
schematically, in Fig. 6.9. This is a Gumbel plot. Its
vertical axis, representing (cumulative) probability, is
deliberately distorted such that if the data were indeed
truly Gumbel distributed, they would plot in a straight
line (in the general direction south-west to north-east,
with north at the top of the plot). Extrapolation of
the upper end (right hand) of the distribution then allows the estimation of the probability of exceedence of
a given depth of pit. This is important in estimating the
probability of failure through perforation of the wall of
a pipe or tank or other steel containment structure.
The approach represented by Fig. 6.9 and as described in many papers has a long history. It is adequate
for relatively shallow pits or, similarly, for relatively
short-term exposures, that is, within phases 0–2 of the
model in Fig. 6.8. However, since the character of pit
growth changes with the commencement of phase 3, the
probabilistic properties will also change. As a result, it
has been shown that for longer exposures, the extreme
value probability distribution will deviate from Gumbel [6.44]. This observation is important for estimating
the probability of failure due to pitting particularly for
infrastructure that can pit severely. Thus, it is directly
relevant, for example, for assessing the life of steel
pipelines used in offshore oil installations.
As in general corrosion, microbiologically influenced corrosion can play a major role in the rate of pit
growth. This can occur under biofilms and under marine growth but also, for example, under the footprint
of marine organisms that settle on steel surfaces. Figure 6.10 shows an example of the localized corrosion
that has occurred after 9 months exposure in seawater.
The example given here is for stainless steel plate as
this has negligible general or uniform corrosion in seawater (at least for shorter exposure periods) and thus
shows the effect of marine organism footprints more
clearly. Similar high rates of localized corrosion can oc-
120 Part A Fundamentals
ture of the defects in a metallic crystal structure but
somewhat later it is influenced also by the cessation
in the growth of some pits (meta stable pits) in favor
of others [6.41]. This can be considered to influence
subsequent pit growth and the development of pitting,
and giving the appearance of randomness also for later
pitting. However, studies of the correlation structure of
larger corroded surfaces show a high degree of uniformity in pit depth with only a small proportion of greater
depth than the remainder [6.42]. Although this finding
tends to undermine statistical analyses (such as those
based on extreme value theory) that are based on each
pit depth being independent from all other pit depths, it
0.5 years
1
4
0
0.5
Probability of
exceedence
= 1– φ (x)
Gumbel distribution
fitted to maximum pit depth data
mild steel, Taylors Beach
1
1.5
2
Gumbel distribution standardised variable w
Cumulative probability
φ (x)
Maximum pit depth (mm)
3
2
1
0
–1
–2
0.95
0.9
0.8
0.7
0.6
0.5
0.4
0.3
0.2
0.1
0.05
Fig. 6.9 Gumbel extreme value plot showing several sets of data
for pit depth
Fig. 6.10 Localized corrosion on a stainless steel plate formed
by sucker footprint of a marine mollusk (centre) and at one of
the identification holes (2 mm diam.) (top left) for one quarter of
a 100 200 mm coupon, after 9 months exposure in coastal seawater. Note that this is a stainless steel plate for which the rest
of the surface has no significant corrosion (although fine pitting is
widespread over the surface when examined under the microscope)
and thus the effect of localized corrosion due to marine growth can
be seen more clearly
is, from a practical perspective, not unexpected. A high
degree of correlation can be expected since the corrosive environment is common to the whole steel surface
and the surface itself is largely homogeneous except for
the microscopic crystal structure and its associated defects. As noted, the latter become almost irrelevant as
corrosion proceeds.
Fortunately, for statistical analyses, a certain degree
of dependence can be tolerated in extreme value analysis, provided it can be assumed that the maximum
pit depths are asymptotically independent, that is, independence of the deepest pit depths can be assumed
as the total number of pits increases [6.43]. Usually,
it is assumed that the deepest pits follow the Gumbel
extreme value distribution and also that the shallowest
pits are of a different statistical distribution and follow an exponential distribution. The concept is shown,
schematically, in Fig. 6.9. This is a Gumbel plot. Its
vertical axis, representing (cumulative) probability, is
deliberately distorted such that if the data were indeed
truly Gumbel distributed, they would plot in a straight
line (in the general direction south-west to north-east,
with north at the top of the plot). Extrapolation of
the upper end (right hand) of the distribution then allows the estimation of the probability of exceedence of
a given depth of pit. This is important in estimating the
probability of failure through perforation of the wall of
a pipe or tank or other steel containment structure.
The approach represented by Fig. 6.9 and as described in many papers has a long history. It is adequate
for relatively shallow pits or, similarly, for relatively
short-term exposures, that is, within phases 0–2 of the
model in Fig. 6.8. However, since the character of pit
growth changes with the commencement of phase 3, the
probabilistic properties will also change. As a result, it
has been shown that for longer exposures, the extreme
value probability distribution will deviate from Gumbel [6.44]. This observation is important for estimating
the probability of failure due to pitting particularly for
infrastructure that can pit severely. Thus, it is directly
relevant, for example, for assessing the life of steel
pipelines used in offshore oil installations.
As in general corrosion, microbiologically influenced corrosion can play a major role in the rate of pit
growth. This can occur under biofilms and under marine growth but also, for example, under the footprint
of marine organisms that settle on steel surfaces. Figure 6.10 shows an example of the localized corrosion
that has occurred after 9 months exposure in seawater.
The example given here is for stainless steel plate as
this has negligible general or uniform corrosion in seawater (at least for shorter exposure periods) and thus
shows the effect of marine organism footprints more
clearly. Similar high rates of localized corrosion can oc-