

Principles of Marine Corrosion 6.6 Pitting Corrosion of Steel 119
Part A | 6.6
Continuous steel strip
Isolated coupons
0
200
400
600
Mean low tide
Mean tide
Splash zone
Mean high tide
Accelerated low water
corrosion effect
Strip profile with nutrient
pollution (schematic)
Immersion zone
800
1000
Distance above mean tide (m)
Schematic corrosion profiles
in the tidal zone
Corrosion loss (× 0.001 mm)
2
1
0
–1
–2
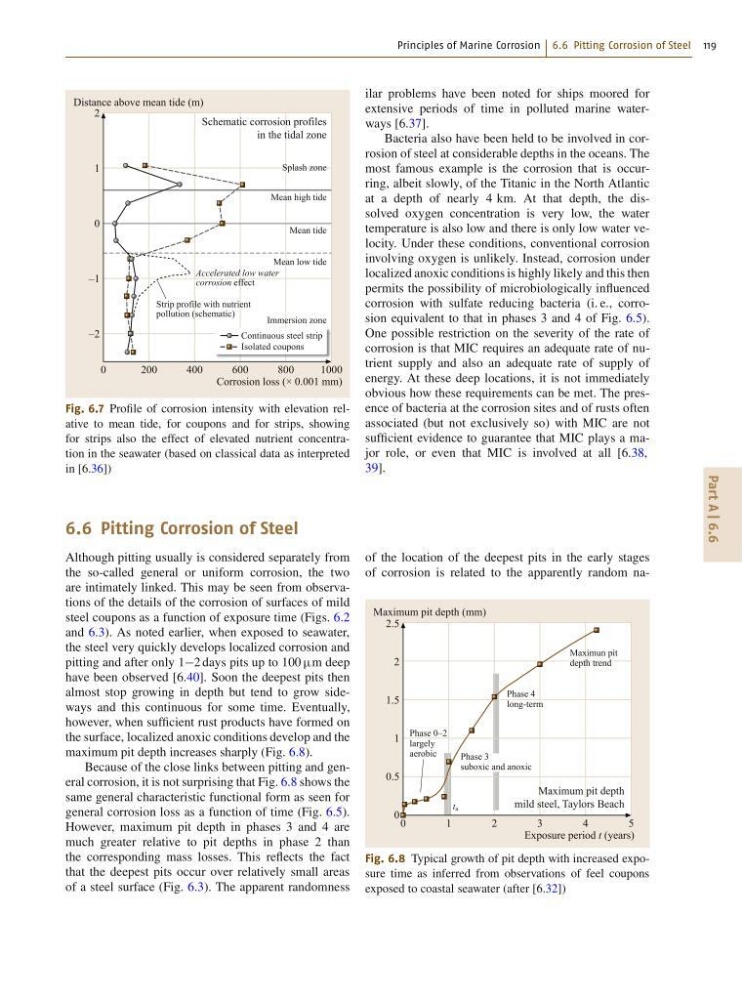
Fig. 6.7 Profile of corrosion intensity with elevation relative to mean tide, for coupons and for strips, showing
for strips also the effect of elevated nutrient concentration in the seawater (based on classical data as interpreted
in [6.36])
ilar problems have been noted for ships moored for
extensive periods of time in polluted marine waterways [6.37].
Bacteria also have been held to be involved in corrosion of steel at considerable depths in the oceans. The
most famous example is the corrosion that is occurring, albeit slowly, of the Titanic in the North Atlantic
at a depth of nearly 4 km. At that depth, the dissolved oxygen concentration is very low, the water
temperature is also low and there is only low water velocity. Under these conditions, conventional corrosion
involving oxygen is unlikely. Instead, corrosion under
localized anoxic conditions is highly likely and this then
permits the possibility of microbiologically influenced
corrosion with sulfate reducing bacteria (i. e., corrosion equivalent to that in phases 3 and 4 of Fig. 6.5).
One possible restriction on the severity of the rate of
corrosion is that MIC requires an adequate rate of nutrient supply and also an adequate rate of supply of
energy. At these deep locations, it is not immediately
obvious how these requirements can be met. The presence of bacteria at the corrosion sites and of rusts often
associated (but not exclusively so) with MIC are not
sufficient evidence to guarantee that MIC plays a major role, or even that MIC is involved at all [6.38,
39].
6.6 Pitting Corrosion of Steel
Although pitting usually is considered separately from
the so-called general or uniform corrosion, the two
are intimately linked. This may be seen from observations of the details of the corrosion of surfaces of mild
steel coupons as a function of exposure time (Figs. 6.2
and 6.3). As noted earlier, when exposed to seawater,
the steel very quickly develops localized corrosion and
pitting and after only 12 days pits up to 100 m deep
have been observed [6.40]. Soon the deepest pits then
almost stop growing in depth but tend to grow sideways and this continuous for some time. Eventually,
however, when sufficient rust products have formed on
the surface, localized anoxic conditions develop and the
maximum pit depth increases sharply (Fig. 6.8).
Because of the close links between pitting and general corrosion, it is not surprising that Fig. 6.8 shows the
same general characteristic functional form as seen for
general corrosion loss as a function of time (Fig. 6.5).
However, maximum pit depth in phases 3 and 4 are
much greater relative to pit depths in phase 2 than
the corresponding mass losses. This reflects the fact
that the deepest pits occur over relatively small areas
of a steel surface (Fig. 6.3). The apparent randomness
of the location of the deepest pits in the early stages
of corrosion is related to the apparently random na0
1
2
3
Maximun pit
depth trend
Phase 3
suboxic and anoxic
Phase 0–2
largely
aerobic
t a
Phase 4
long-term
4
5
Maximum pit depth (mm)
Maximum pit depth
mild steel, Taylors Beach
Exposure period t (years)
2.5
2
1.5
1
0.5
0
Fig. 6.8 Typical growth of pit depth with increased exposure time as inferred from observations of feel coupons
exposed to coastal seawater (after [6.32])
Part A | 6.6
Continuous steel strip
Isolated coupons
0
200
400
600
Mean low tide
Mean tide
Splash zone
Mean high tide
Accelerated low water
corrosion effect
Strip profile with nutrient
pollution (schematic)
Immersion zone
800
1000
Distance above mean tide (m)
Schematic corrosion profiles
in the tidal zone
Corrosion loss (× 0.001 mm)
2
1
0
–1
–2
Fig. 6.7 Profile of corrosion intensity with elevation relative to mean tide, for coupons and for strips, showing
for strips also the effect of elevated nutrient concentration in the seawater (based on classical data as interpreted
in [6.36])
ilar problems have been noted for ships moored for
extensive periods of time in polluted marine waterways [6.37].
Bacteria also have been held to be involved in corrosion of steel at considerable depths in the oceans. The
most famous example is the corrosion that is occurring, albeit slowly, of the Titanic in the North Atlantic
at a depth of nearly 4 km. At that depth, the dissolved oxygen concentration is very low, the water
temperature is also low and there is only low water velocity. Under these conditions, conventional corrosion
involving oxygen is unlikely. Instead, corrosion under
localized anoxic conditions is highly likely and this then
permits the possibility of microbiologically influenced
corrosion with sulfate reducing bacteria (i. e., corrosion equivalent to that in phases 3 and 4 of Fig. 6.5).
One possible restriction on the severity of the rate of
corrosion is that MIC requires an adequate rate of nutrient supply and also an adequate rate of supply of
energy. At these deep locations, it is not immediately
obvious how these requirements can be met. The presence of bacteria at the corrosion sites and of rusts often
associated (but not exclusively so) with MIC are not
sufficient evidence to guarantee that MIC plays a major role, or even that MIC is involved at all [6.38,
39].
6.6 Pitting Corrosion of Steel
Although pitting usually is considered separately from
the so-called general or uniform corrosion, the two
are intimately linked. This may be seen from observations of the details of the corrosion of surfaces of mild
steel coupons as a function of exposure time (Figs. 6.2
and 6.3). As noted earlier, when exposed to seawater,
the steel very quickly develops localized corrosion and
pitting and after only 12 days pits up to 100 m deep
have been observed [6.40]. Soon the deepest pits then
almost stop growing in depth but tend to grow sideways and this continuous for some time. Eventually,
however, when sufficient rust products have formed on
the surface, localized anoxic conditions develop and the
maximum pit depth increases sharply (Fig. 6.8).
Because of the close links between pitting and general corrosion, it is not surprising that Fig. 6.8 shows the
same general characteristic functional form as seen for
general corrosion loss as a function of time (Fig. 6.5).
However, maximum pit depth in phases 3 and 4 are
much greater relative to pit depths in phase 2 than
the corresponding mass losses. This reflects the fact
that the deepest pits occur over relatively small areas
of a steel surface (Fig. 6.3). The apparent randomness
of the location of the deepest pits in the early stages
of corrosion is related to the apparently random na0
1
2
3
Maximun pit
depth trend
Phase 3
suboxic and anoxic
Phase 0–2
largely
aerobic
t a
Phase 4
long-term
4
5
Maximum pit depth (mm)
Maximum pit depth
mild steel, Taylors Beach
Exposure period t (years)
2.5
2
1.5
1
0.5
0
Fig. 6.8 Typical growth of pit depth with increased exposure time as inferred from observations of feel coupons
exposed to coastal seawater (after [6.32])