

Principles of Marine Corrosion 6.4 Modeling Longer Term Corrosion of Steel 117
Part A | 6.4
r 0
r b
r a
r s
a) Corrosion
b) Corrosion
Phase 0 – Kinetic controlled
oxidation and potential
bacterial influence
Phase 1– Concentration-controlled oxidation
Phase 3 – Hydrogen reduction
and potential bacterial influence
Phase 2 – Diffusion-controlled
oxidation and polarization
Phase 4 – Steady state
with diffusion control
Increasing
nutrient levels
Base
case
Exposure period
C s
C a
t a
r 0
T 1
T 2
T 3
Increasing
temperature
Reducing [O]
[O] 1
[O] 2
[O] 3
Locus of (c a , t a ) with [O]
Base
case
Exposure period
C a
t a
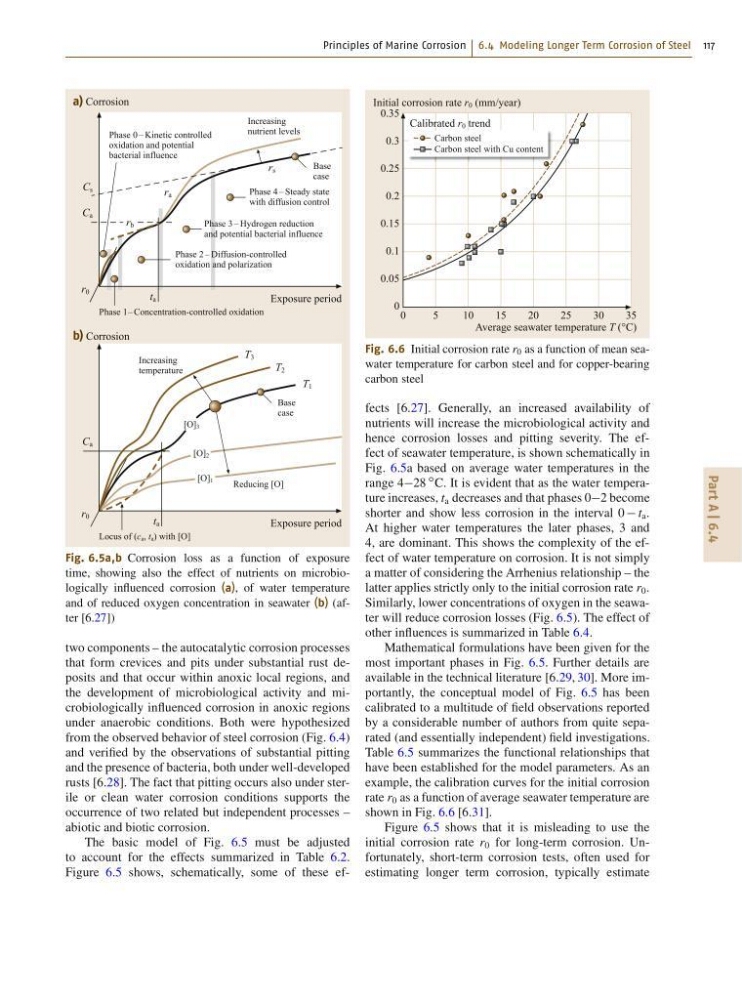
Fig. 6.5a,b Corrosion loss as a function of exposure
time, showing also the effect of nutrients on microbiologically influenced corrosion (a), of water temperature
and of reduced oxygen concentration in seawater (b) (after [6.27])
two components – the autocatalytic corrosion processes
that form crevices and pits under substantial rust deposits and that occur within anoxic local regions, and
the development of microbiological activity and microbiologically influenced corrosion in anoxic regions
under anaerobic conditions. Both were hypothesized
from the observed behavior of steel corrosion (Fig. 6.4)
and verified by the observations of substantial pitting
and the presence of bacteria, both under well-developed
rusts [6.28]. The fact that pitting occurs also under sterile or clean water corrosion conditions supports the
occurrence of two related but independent processes –
abiotic and biotic corrosion.
The basic model of Fig. 6.5 must be adjusted
to account for the effects summarized in Table 6.2.
Figure 6.5 shows, schematically, some of these efCarbon steel
Carbon steel with Cu content
0
5
10
15
20
25
30
35
Initial corrosion rate r 0 (mm/year)
Calibrated r 0 trend
Average seawater temperature T (°C)
0.35
0.3
0.25
0.2
0.15
0.1
0.05
0
Fig. 6.6 Initial corrosion rate r 0 as a function of mean seawater temperature for carbon steel and for copper-bearing
carbon steel
fects [6.27]. Generally, an increased availability of
nutrients will increase the microbiological activity and
hence corrosion losses and pitting severity. The effect of seawater temperature, is shown schematically in
Fig. 6.5a based on average water temperatures in the
range 428
ı C. It is evident that as the water temperature increases, t a decreases and that phases 02 become
shorter and show less corrosion in the interval 0 t a .
At higher water temperatures the later phases, 3 and
4, are dominant. This shows the complexity of the effect of water temperature on corrosion. It is not simply
a matter of considering the Arrhenius relationship – the
latter applies strictly only to the initial corrosion rate r 0 .
Similarly, lower concentrations of oxygen in the seawater will reduce corrosion losses (Fig. 6.5). The effect of
other influences is summarized in Table 6.4.
Mathematical formulations have been given for the
most important phases in Fig. 6.5. Further details are
available in the technical literature [6.29, 30]. More importantly, the conceptual model of Fig. 6.5 has been
calibrated to a multitude of field observations reported
by a considerable number of authors from quite separated (and essentially independent) field investigations.
Table 6.5 summarizes the functional relationships that
have been established for the model parameters. As an
example, the calibration curves for the initial corrosion
rate r 0 as a function of average seawater temperature are
shown in Fig. 6.6 [6.31].
Figure 6.5 shows that it is misleading to use the
initial corrosion rate r 0 for long-term corrosion. Unfortunately, short-term corrosion tests, often used for
estimating longer term corrosion, typically estimate
Part A | 6.4
r 0
r b
r a
r s
a) Corrosion
b) Corrosion
Phase 0 – Kinetic controlled
oxidation and potential
bacterial influence
Phase 1– Concentration-controlled oxidation
Phase 3 – Hydrogen reduction
and potential bacterial influence
Phase 2 – Diffusion-controlled
oxidation and polarization
Phase 4 – Steady state
with diffusion control
Increasing
nutrient levels
Base
case
Exposure period
C s
C a
t a
r 0
T 1
T 2
T 3
Increasing
temperature
Reducing [O]
[O] 1
[O] 2
[O] 3
Locus of (c a , t a ) with [O]
Base
case
Exposure period
C a
t a
Fig. 6.5a,b Corrosion loss as a function of exposure
time, showing also the effect of nutrients on microbiologically influenced corrosion (a), of water temperature
and of reduced oxygen concentration in seawater (b) (after [6.27])
two components – the autocatalytic corrosion processes
that form crevices and pits under substantial rust deposits and that occur within anoxic local regions, and
the development of microbiological activity and microbiologically influenced corrosion in anoxic regions
under anaerobic conditions. Both were hypothesized
from the observed behavior of steel corrosion (Fig. 6.4)
and verified by the observations of substantial pitting
and the presence of bacteria, both under well-developed
rusts [6.28]. The fact that pitting occurs also under sterile or clean water corrosion conditions supports the
occurrence of two related but independent processes –
abiotic and biotic corrosion.
The basic model of Fig. 6.5 must be adjusted
to account for the effects summarized in Table 6.2.
Figure 6.5 shows, schematically, some of these efCarbon steel
Carbon steel with Cu content
0
5
10
15
20
25
30
35
Initial corrosion rate r 0 (mm/year)
Calibrated r 0 trend
Average seawater temperature T (°C)
0.35
0.3
0.25
0.2
0.15
0.1
0.05
0
Fig. 6.6 Initial corrosion rate r 0 as a function of mean seawater temperature for carbon steel and for copper-bearing
carbon steel
fects [6.27]. Generally, an increased availability of
nutrients will increase the microbiological activity and
hence corrosion losses and pitting severity. The effect of seawater temperature, is shown schematically in
Fig. 6.5a based on average water temperatures in the
range 428
ı C. It is evident that as the water temperature increases, t a decreases and that phases 02 become
shorter and show less corrosion in the interval 0 t a .
At higher water temperatures the later phases, 3 and
4, are dominant. This shows the complexity of the effect of water temperature on corrosion. It is not simply
a matter of considering the Arrhenius relationship – the
latter applies strictly only to the initial corrosion rate r 0 .
Similarly, lower concentrations of oxygen in the seawater will reduce corrosion losses (Fig. 6.5). The effect of
other influences is summarized in Table 6.4.
Mathematical formulations have been given for the
most important phases in Fig. 6.5. Further details are
available in the technical literature [6.29, 30]. More importantly, the conceptual model of Fig. 6.5 has been
calibrated to a multitude of field observations reported
by a considerable number of authors from quite separated (and essentially independent) field investigations.
Table 6.5 summarizes the functional relationships that
have been established for the model parameters. As an
example, the calibration curves for the initial corrosion
rate r 0 as a function of average seawater temperature are
shown in Fig. 6.6 [6.31].
Figure 6.5 shows that it is misleading to use the
initial corrosion rate r 0 for long-term corrosion. Unfortunately, short-term corrosion tests, often used for
estimating longer term corrosion, typically estimate