

74
Multiscale Hydrologic Remote Sensing: Perspectives and Applications
(bands 9 and 10) and to thermal infrared (band 11). The CASI-2 sensor has been
set up to detect specific vegetation characteristics by recording the spectral radiance in 12 VIS and NIR narrow bands. A field survey has been simultaneously carried out to measure spectral and physiological vegetation parameters. An empirical
line method (Slater et al. 1996) has been applied to calibrate and correct CASI-2
images. Albedo and vegetation index maps have been retrieved using these spectral
reflectance bands. The temperatures recorded by the ATM thermal band were compared to ground temperatures measured at the same time of the acquisition in several
points to allow an empirical calibration.
The ASTER image was recorded on August 16, 2005 (day of the year [DOY] 229) at
about 1100 h local time. The image has been georeferenced, radiometrically calibrated
(Epema 1990), and atmospherically corrected (Chavez 1988). As for the ATM thermal image, the atmospherically corrected radiometric temperature has been retrieved
using field temperature measures carried out simultaneously to the satellite overpass.
4.5 APPLICATIONS AND RESULTS
The three models described in the previous sections were applied to the remotely
sensed data set. In particular, as a preliminary analysis, models’ performances were
tested based on the 2008 data set when micrometeorological measurements were
available. Successively, the effects of spatial resolution were discussed using the
2005 multiresolution data set.
4.5.1 Model PeRfoRMance coMPaRiSon
The comparison among the three models introduced in Section 4.2 was performed in
terms of ET d , considering this output as a synthetic descriptor of all the modeled fluxes
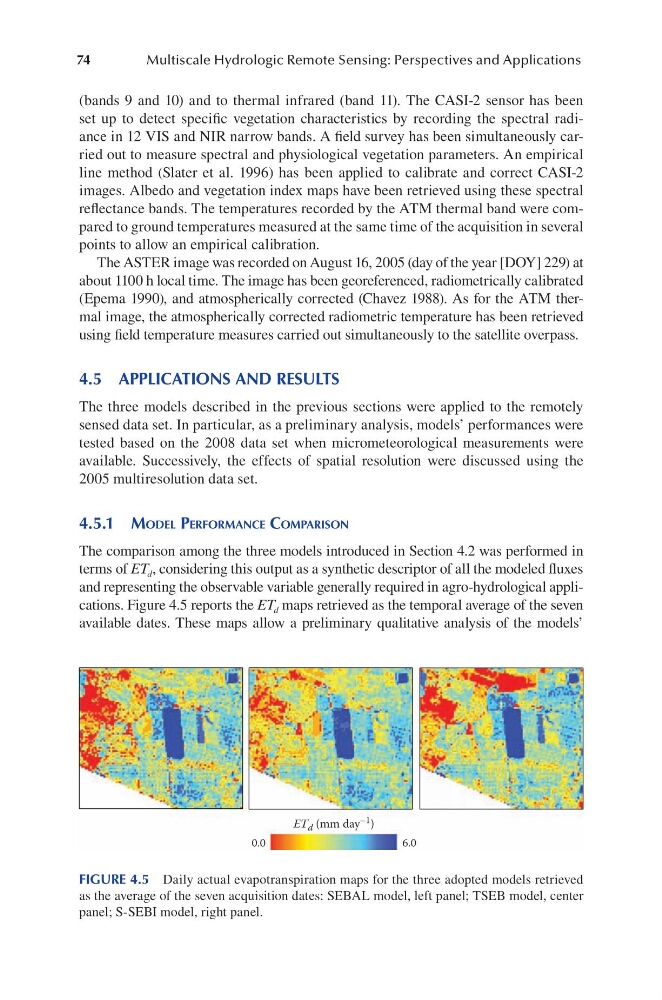
and representing the observable variable generally required in agro-hydrological applications. Figure 4.5 reports the ET d maps retrieved as the temporal average of the seven
available dates. These maps allow a preliminary qualitative analysis of the models’
ET d (mm day –1 )
0.0
6.0
FIGURE 4.5 Daily actual evapotranspiration maps for the three adopted models retrieved
as the average of the seven acquisition dates: SEBAL model, left panel; TSEB model, center
panel; S-SEBI model, right panel.
Multiscale Hydrologic Remote Sensing: Perspectives and Applications
(bands 9 and 10) and to thermal infrared (band 11). The CASI-2 sensor has been
set up to detect specific vegetation characteristics by recording the spectral radiance in 12 VIS and NIR narrow bands. A field survey has been simultaneously carried out to measure spectral and physiological vegetation parameters. An empirical
line method (Slater et al. 1996) has been applied to calibrate and correct CASI-2
images. Albedo and vegetation index maps have been retrieved using these spectral
reflectance bands. The temperatures recorded by the ATM thermal band were compared to ground temperatures measured at the same time of the acquisition in several
points to allow an empirical calibration.
The ASTER image was recorded on August 16, 2005 (day of the year [DOY] 229) at
about 1100 h local time. The image has been georeferenced, radiometrically calibrated
(Epema 1990), and atmospherically corrected (Chavez 1988). As for the ATM thermal image, the atmospherically corrected radiometric temperature has been retrieved
using field temperature measures carried out simultaneously to the satellite overpass.
4.5 APPLICATIONS AND RESULTS
The three models described in the previous sections were applied to the remotely
sensed data set. In particular, as a preliminary analysis, models’ performances were
tested based on the 2008 data set when micrometeorological measurements were
available. Successively, the effects of spatial resolution were discussed using the
2005 multiresolution data set.
4.5.1 Model PeRfoRMance coMPaRiSon
The comparison among the three models introduced in Section 4.2 was performed in
terms of ET d , considering this output as a synthetic descriptor of all the modeled fluxes
and representing the observable variable generally required in agro-hydrological applications. Figure 4.5 reports the ET d maps retrieved as the temporal average of the seven
available dates. These maps allow a preliminary qualitative analysis of the models’
ET d (mm day –1 )
0.0
6.0
FIGURE 4.5 Daily actual evapotranspiration maps for the three adopted models retrieved
as the average of the seven acquisition dates: SEBAL model, left panel; TSEB model, center
panel; S-SEBI model, right panel.