

70
Multiscale Hydrologic Remote Sensing: Perspectives and Applications
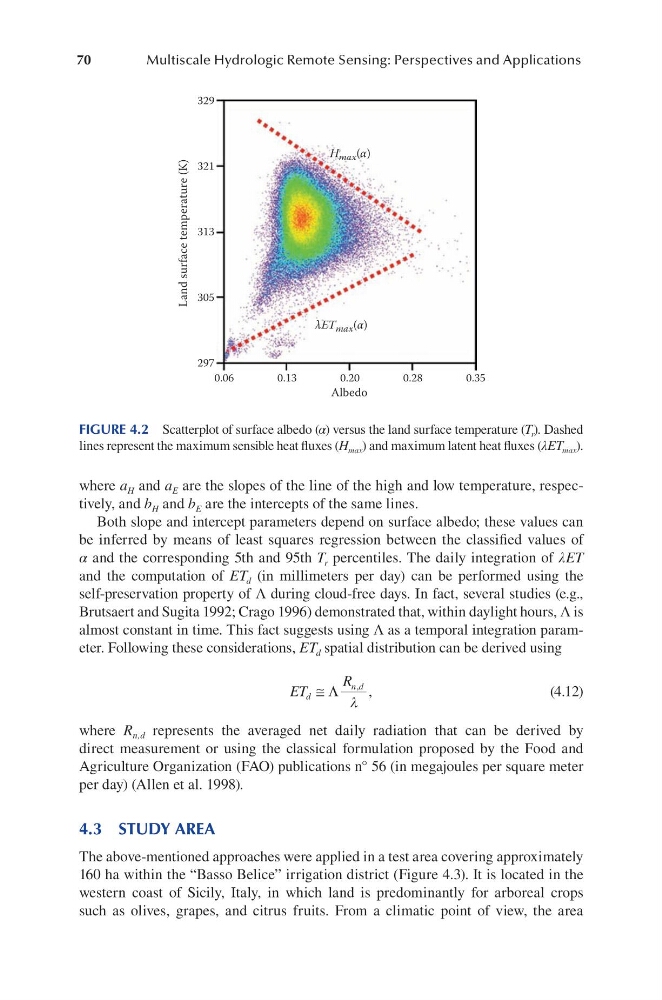
where a H and a E are the slopes of the line of the high and low temperature, respectively, and b H and b E are the intercepts of the same lines.
Both slope and intercept parameters depend on surface albedo; these values can
be inferred by means of least squares regression between the classified values of
α and the corresponding 5th and 95th T r percentiles. The daily integration of λET
and the computation of ET d (in millimeters per day) can be performed using the
self-preservation property of Λ during cloud-free days. In fact, several studies (e.g.,
Brutsaert and Sugita 1992; Crago 1996) demonstrated that, within daylight hours, Λ is
almost constant in time. This fact suggests using Λ as a temporal integration parameter. Following these considerations, ET d spatial distribution can be derived using
ET
R
d
n d
≅ Λ
, ,
λ
(4.12)
where R n,d represents the averaged net daily radiation that can be derived by
direct measurement or using the classical formulation proposed by the Food and
Agriculture Organization (FAO) publications n° 56 (in megajoules per square meter
per day) (Allen et al. 1998).
4.3 STUDY AREA
The above-mentioned approaches were applied in a test area covering approximately
160 ha within the “Basso Belice” irrigation district (Figure 4.3). It is located in the
western coast of Sicily, Italy, in which land is predominantly for arboreal crops
such as olives, grapes, and citrus fruits. From a climatic point of view, the area
329
321
313
305
297
0.06
0.13
0.20
0.28
0.35
Albedo
H max (α)
λET max (α)
Land surface temperature (K)
FIGURE 4.2 Scatterplot of surface albedo (α) versus the land surface temperature (T r ). Dashed
lines represent the maximum sensible heat fluxes (H max ) and maximum latent heat fluxes (λET max ).
Multiscale Hydrologic Remote Sensing: Perspectives and Applications
where a H and a E are the slopes of the line of the high and low temperature, respectively, and b H and b E are the intercepts of the same lines.
Both slope and intercept parameters depend on surface albedo; these values can
be inferred by means of least squares regression between the classified values of
α and the corresponding 5th and 95th T r percentiles. The daily integration of λET
and the computation of ET d (in millimeters per day) can be performed using the
self-preservation property of Λ during cloud-free days. In fact, several studies (e.g.,
Brutsaert and Sugita 1992; Crago 1996) demonstrated that, within daylight hours, Λ is
almost constant in time. This fact suggests using Λ as a temporal integration parameter. Following these considerations, ET d spatial distribution can be derived using
ET
R
d
n d
≅ Λ
, ,
λ
(4.12)
where R n,d represents the averaged net daily radiation that can be derived by
direct measurement or using the classical formulation proposed by the Food and
Agriculture Organization (FAO) publications n° 56 (in megajoules per square meter
per day) (Allen et al. 1998).
4.3 STUDY AREA
The above-mentioned approaches were applied in a test area covering approximately
160 ha within the “Basso Belice” irrigation district (Figure 4.3). It is located in the
western coast of Sicily, Italy, in which land is predominantly for arboreal crops
such as olives, grapes, and citrus fruits. From a climatic point of view, the area
329
321
313
305
297
0.06
0.13
0.20
0.28
0.35
Albedo
H max (α)
λET max (α)
Land surface temperature (K)
FIGURE 4.2 Scatterplot of surface albedo (α) versus the land surface temperature (T r ). Dashed
lines represent the maximum sensible heat fluxes (H max ) and maximum latent heat fluxes (λET max ).