

50
Multiscale Hydrologic Remote Sensing: Perspectives and Applications
the center of the image is identified as the shipping way (Lister Landtief), which is
also shown in Figure 3.1. To determine a common reference, the tidal gauge measurements extrapolated in the area of interest were used. The area of results could
be separated into three distinct subareas that were near the shore (southeast), the
channel, and the shoaling (northwest) according to the basic geomorphological characteristics. The minimum depth retrieved by DiSC is approximately 4 m, which
is the limit of the method, due to the spatial resolution of the radar and the wave
conditions. At its core is the linear dispersion relation that is not a valid assumption
over the shoals. The area of investigation is on the eastern coast of the North Sea,
where the fetch for the development of the waves is large enough for the creation and
propagation of long waves, which have the additional effect of the wind during the
storm. These waves, which indicate the bathymetric and current field information,
tend to break in shallow areas. This affects the microwave imaging of the waves, and
the assumed wave model is no longer applicable.
The comparison of the bathymetries between periods A and B demonstrates
that there is appreciable sediment accretion in the channel of approximately 0.5 m.
During period A, the spatial pattern of the depth is uniform and well formed, whereas
during period B, the influence of the storm is obvious. The bathymetry of the channel presents discontinuities, and the isodepth patches in the channel are no longer
uniform. The near-shore geomorphological structures have propagated from south to
north as an effect of the dominant wind and wave conditions. This is most obvious at
the northern part, where the channel has narrowed.
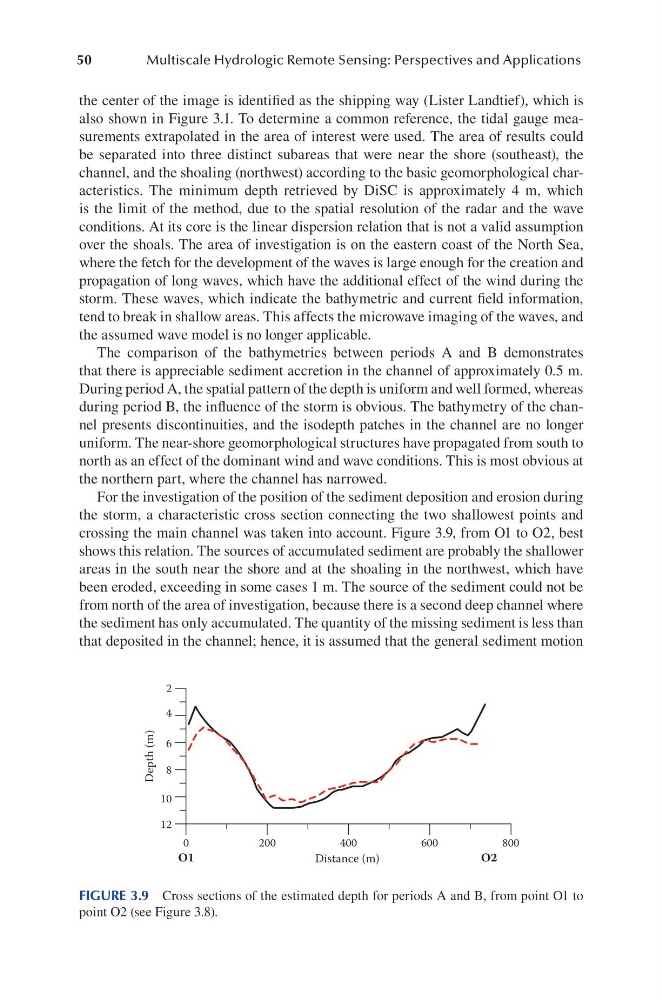
For the investigation of the position of the sediment deposition and erosion during
the storm, a characteristic cross section connecting the two shallowest points and
crossing the main channel was taken into account. Figure 3.9, from O1 to O2, best
shows this relation. The sources of accumulated sediment are probably the shallower
areas in the south near the shore and at the shoaling in the northwest, which have
been eroded, exceeding in some cases 1 m. The source of the sediment could not be
from north of the area of investigation, because there is a second deep channel where
the sediment has only accumulated. The quantity of the missing sediment is less than
that deposited in the channel; hence, it is assumed that the general sediment motion
2
4
6
8
10
12
0
200
400
600
800
Distance (m)
Depth (m)
O1
O2
FIGURE 3.9 Cross sections of the estimated depth for periods A and B, from point O1 to
point O2 (see Figure 3.8).
Multiscale Hydrologic Remote Sensing: Perspectives and Applications
the center of the image is identified as the shipping way (Lister Landtief), which is
also shown in Figure 3.1. To determine a common reference, the tidal gauge measurements extrapolated in the area of interest were used. The area of results could
be separated into three distinct subareas that were near the shore (southeast), the
channel, and the shoaling (northwest) according to the basic geomorphological characteristics. The minimum depth retrieved by DiSC is approximately 4 m, which
is the limit of the method, due to the spatial resolution of the radar and the wave
conditions. At its core is the linear dispersion relation that is not a valid assumption
over the shoals. The area of investigation is on the eastern coast of the North Sea,
where the fetch for the development of the waves is large enough for the creation and
propagation of long waves, which have the additional effect of the wind during the
storm. These waves, which indicate the bathymetric and current field information,
tend to break in shallow areas. This affects the microwave imaging of the waves, and
the assumed wave model is no longer applicable.
The comparison of the bathymetries between periods A and B demonstrates
that there is appreciable sediment accretion in the channel of approximately 0.5 m.
During period A, the spatial pattern of the depth is uniform and well formed, whereas
during period B, the influence of the storm is obvious. The bathymetry of the channel presents discontinuities, and the isodepth patches in the channel are no longer
uniform. The near-shore geomorphological structures have propagated from south to
north as an effect of the dominant wind and wave conditions. This is most obvious at
the northern part, where the channel has narrowed.
For the investigation of the position of the sediment deposition and erosion during
the storm, a characteristic cross section connecting the two shallowest points and
crossing the main channel was taken into account. Figure 3.9, from O1 to O2, best
shows this relation. The sources of accumulated sediment are probably the shallower
areas in the south near the shore and at the shoaling in the northwest, which have
been eroded, exceeding in some cases 1 m. The source of the sediment could not be
from north of the area of investigation, because there is a second deep channel where
the sediment has only accumulated. The quantity of the missing sediment is less than
that deposited in the channel; hence, it is assumed that the general sediment motion
2
4
6
8
10
12
0
200
400
600
800
Distance (m)
Depth (m)
O1
O2
FIGURE 3.9 Cross sections of the estimated depth for periods A and B, from point O1 to
point O2 (see Figure 3.8).