

496
Multiscale Hydrologic Remote Sensing: Perspectives and Applications
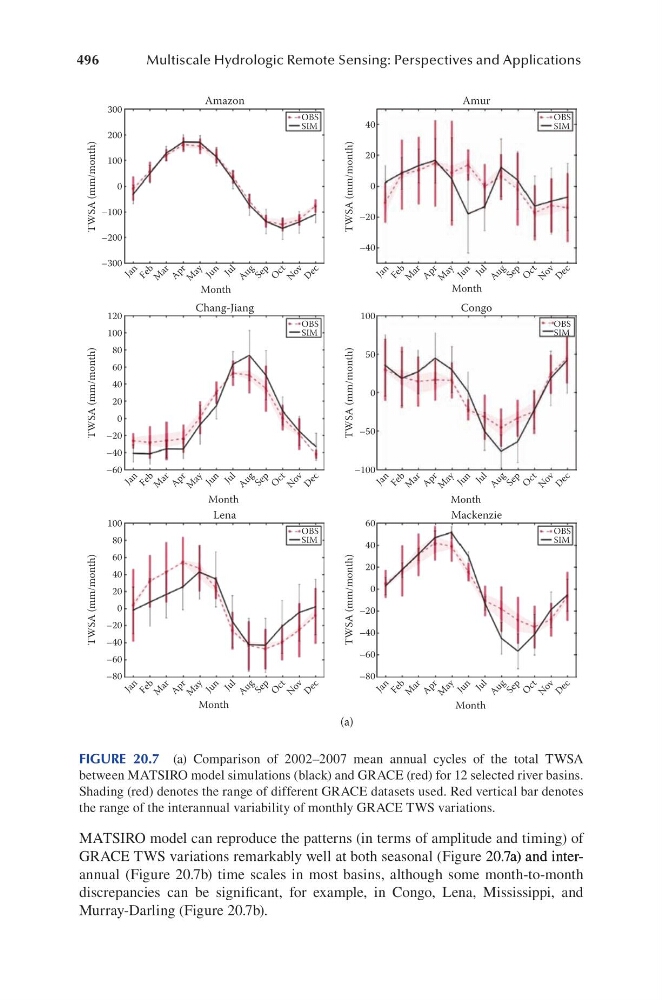
MATSIRO model can reproduce the patterns (in terms of amplitude and timing) of
GRACE TWS variations remarkably well at both seasonal (Figure 20.7a) and inter20.7a) and inter.7a) and interannual (Figure 20.7b) time scales in most basins, although some month-to-month
discrepancies can be significant, for example, in Congo, Lena, Mississippi, and
Murray-Darling (Figure 20.7b).
300
200
100
–100
–200
–300
0
120
100
80
0
–20
–60
–40
60
40
20
100
80
0
–20
–60
–80
–40
60
40
20
40
20
–20
–40
0
100
0
–100
–50
50
60
0
–20
–60
–80
–40
40
20
J a n
F e b
M
a r
A
p r
M
a y
J u n
J u l
A
u g
S e p
O
c t
N
o v
D
e c
J a n
F e b
M
a r
A
p r
M
a y
J u n
J u l
A
u g
S e p
O
c t
N
o v
D
e c
J a n
F e b
M
a r
A
p r
M
a y
J u n
J u l
A
u g
S e p
O
c t
N
o v
D
e c
J a n
F e b
M
a r
A
p r
M
a y
J u n
J u l
A
u g
S e p
O
c t
N
o v
D
e c
J a n
F e b
M
a r
A
p r
M
a y
J u n
J u l
A
u g
S e p
O
c t
N
o v
D
e c
J a n
F e b
M
a r
A
p r
M
a y
J u n
J u l
A
u g
S e p
O
c t
N
o v
D
e c
OBS
SIM
OBS
SIM
OBS
SIM
OBS
SIM
OBS
SIM
OBS
SIM
Amazon
Amur
Chang-Jiang
Congo
Lena
Mackenzie
TWSA (mm/month)
TWSA (mm/month)
TWSA (mm/month)
TWSA (mm/month)
TWSA (mm/month)
TWSA (mm/month)
Month
Month
Month
Month
Month
Month
(a)
FIGURE 20.7 (a) Comparison of 2002–2007 mean annual cycles of the total TWSA
between MATSIRO model simulations (black) and GRACE (red) for 12 selected river basins.
Shading (red) denotes the range of different GRACE datasets used. Red vertical bar denotes
the range of the interannual variability of monthly GRACE TWS variations.
Multiscale Hydrologic Remote Sensing: Perspectives and Applications
MATSIRO model can reproduce the patterns (in terms of amplitude and timing) of
GRACE TWS variations remarkably well at both seasonal (Figure 20.7a) and inter20.7a) and inter.7a) and interannual (Figure 20.7b) time scales in most basins, although some month-to-month
discrepancies can be significant, for example, in Congo, Lena, Mississippi, and
Murray-Darling (Figure 20.7b).
300
200
100
–100
–200
–300
0
120
100
80
0
–20
–60
–40
60
40
20
100
80
0
–20
–60
–80
–40
60
40
20
40
20
–20
–40
0
100
0
–100
–50
50
60
0
–20
–60
–80
–40
40
20
J a n
F e b
M
a r
A
p r
M
a y
J u n
J u l
A
u g
S e p
O
c t
N
o v
D
e c
J a n
F e b
M
a r
A
p r
M
a y
J u n
J u l
A
u g
S e p
O
c t
N
o v
D
e c
J a n
F e b
M
a r
A
p r
M
a y
J u n
J u l
A
u g
S e p
O
c t
N
o v
D
e c
J a n
F e b
M
a r
A
p r
M
a y
J u n
J u l
A
u g
S e p
O
c t
N
o v
D
e c
J a n
F e b
M
a r
A
p r
M
a y
J u n
J u l
A
u g
S e p
O
c t
N
o v
D
e c
J a n
F e b
M
a r
A
p r
M
a y
J u n
J u l
A
u g
S e p
O
c t
N
o v
D
e c
OBS
SIM
OBS
SIM
OBS
SIM
OBS
SIM
OBS
SIM
OBS
SIM
Amazon
Amur
Chang-Jiang
Congo
Lena
Mackenzie
TWSA (mm/month)
TWSA (mm/month)
TWSA (mm/month)
TWSA (mm/month)
TWSA (mm/month)
TWSA (mm/month)
Month
Month
Month
Month
Month
Month
(a)
FIGURE 20.7 (a) Comparison of 2002–2007 mean annual cycles of the total TWSA
between MATSIRO model simulations (black) and GRACE (red) for 12 selected river basins.
Shading (red) denotes the range of different GRACE datasets used. Red vertical bar denotes
the range of the interannual variability of monthly GRACE TWS variations.