

495
Validation for Terrestrial Water Storage Variations
well with observed timing of negative TWSA peak in 2005, all the smoothed data
exhibited a consistent 2-month shift from July to September, reflecting the sensitivity of the adopted smoothing filters to estimated GRACE TWS signals. Smoothing
(spatial averaging) of GRACE data is necessary to reduce the contribution of noisy
short-wavelength components of the gravity field solutions. The estimated monthly sets
of the spherical harmonic coefficients representing monthly mean global gravity fields
is known to contain temporal aliasing errors, which are related to submonthly mass
variations of atmospheric and oceanic circulations. For more discussion on this issue,
see the work of Han et al. (2004), Winsemius et al. (2006), and Schmidt et al. (2008).
20.5.2 gRace twSa veRSuS hydRological Model
SiMulation in laRge RiveR BaSinS
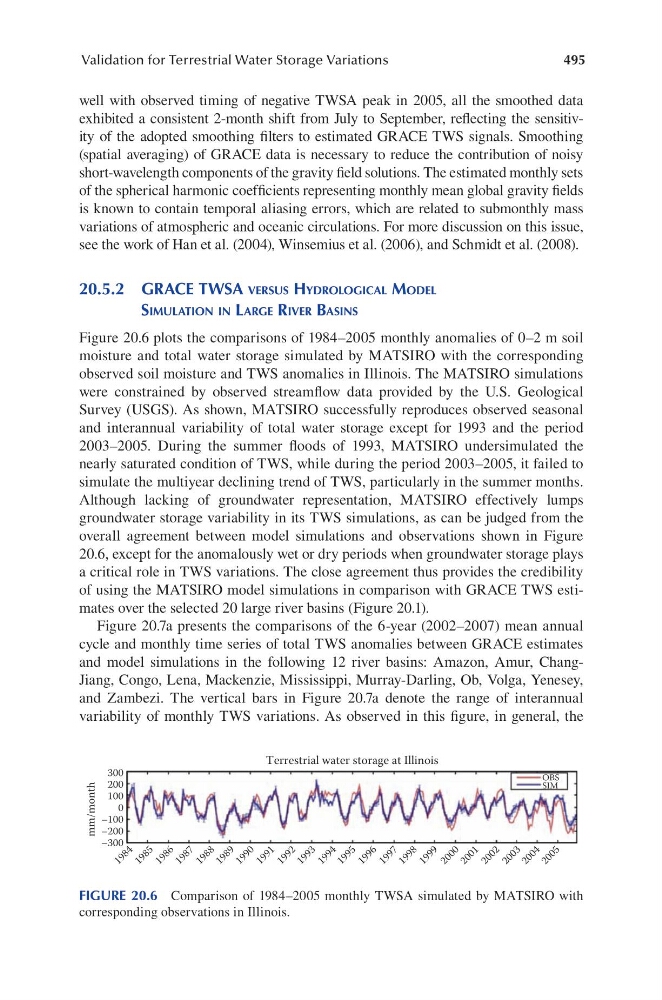
Figure 20.6 plots the comparisons of 1984–2005 monthly anomalies of 0–2 m soil
moisture and total water storage simulated by MATSIRO with the corresponding
observed soil moisture and TWS anomalies in Illinois. The MATSIRO simulations
were constrained by observed streamflow data provided by the U.S. Geological
Survey (USGS). As shown, MATSIRO successfully reproduces observed seasonal
and interannual variability of total water storage except for 1993 and the period
2003–2005. During the summer floods of 1993, MATSIRO undersimulated the
nearly saturated condition of TWS, while during the period 2003–2005, it failed to
simulate the multiyear declining trend of TWS, particularly in the summer months.
Although lacking of groundwater representation, MATSIRO effectively lumps
groundwater storage variability in its TWS simulations, as can be judged from the
overall agreement between model simulations and observations shown in Figure
20.6, except for the anomalously wet or dry periods when groundwater storage plays
a critical role in TWS variations. The close agreement thus provides the credibility
of using the MATSIRO model simulations in comparison with GRACE TWS estimates over the selected 20 large river basins (Figure 20.1).
Figure 20.7a presents the comparisons of the 6-year (2002–2007) mean annual
cycle and monthly time series of total TWS anomalies between GRACE estimates
and model simulations in the following 12 river basins: Amazon, Amur, ChangJiang, Congo, Lena, Mackenzie, Mississippi, Murray-Darling, Ob, Volga, Yenesey,
and Zambezi. The vertical bars in Figure 20.7a denote the range of interannual
variability of monthly TWS variations. As observed in this figure, in general, the
Terrestrial water storage at Illinois
mm/month
300
OBS
SIM
200
100
–100
–200
–300
1 9 8 4
1 9 8 5
1 9 8 6
1 9 8 7
1 9 8 8
1 9 8 9
1 9 9 0
1 9 9 1
1 9 9 2
1 9 9 3
1 9 9 4
1 9 9 5
1 9 9 6
1 9 9 7
1 9 9 8
1 9 9 9
2 0 0 0
2 0 0 1
2 0 0 2
2 0 0 3
2 0 0 4
2 0 0 5
0
FIGURE 20.6 Comparison of 1984–2005 monthly TWSA simulated by MATSIRO with
corresponding observations in Illinois.
Validation for Terrestrial Water Storage Variations
well with observed timing of negative TWSA peak in 2005, all the smoothed data
exhibited a consistent 2-month shift from July to September, reflecting the sensitivity of the adopted smoothing filters to estimated GRACE TWS signals. Smoothing
(spatial averaging) of GRACE data is necessary to reduce the contribution of noisy
short-wavelength components of the gravity field solutions. The estimated monthly sets
of the spherical harmonic coefficients representing monthly mean global gravity fields
is known to contain temporal aliasing errors, which are related to submonthly mass
variations of atmospheric and oceanic circulations. For more discussion on this issue,
see the work of Han et al. (2004), Winsemius et al. (2006), and Schmidt et al. (2008).
20.5.2 gRace twSa veRSuS hydRological Model
SiMulation in laRge RiveR BaSinS
Figure 20.6 plots the comparisons of 1984–2005 monthly anomalies of 0–2 m soil
moisture and total water storage simulated by MATSIRO with the corresponding
observed soil moisture and TWS anomalies in Illinois. The MATSIRO simulations
were constrained by observed streamflow data provided by the U.S. Geological
Survey (USGS). As shown, MATSIRO successfully reproduces observed seasonal
and interannual variability of total water storage except for 1993 and the period
2003–2005. During the summer floods of 1993, MATSIRO undersimulated the
nearly saturated condition of TWS, while during the period 2003–2005, it failed to
simulate the multiyear declining trend of TWS, particularly in the summer months.
Although lacking of groundwater representation, MATSIRO effectively lumps
groundwater storage variability in its TWS simulations, as can be judged from the
overall agreement between model simulations and observations shown in Figure
20.6, except for the anomalously wet or dry periods when groundwater storage plays
a critical role in TWS variations. The close agreement thus provides the credibility
of using the MATSIRO model simulations in comparison with GRACE TWS estimates over the selected 20 large river basins (Figure 20.1).
Figure 20.7a presents the comparisons of the 6-year (2002–2007) mean annual
cycle and monthly time series of total TWS anomalies between GRACE estimates
and model simulations in the following 12 river basins: Amazon, Amur, ChangJiang, Congo, Lena, Mackenzie, Mississippi, Murray-Darling, Ob, Volga, Yenesey,
and Zambezi. The vertical bars in Figure 20.7a denote the range of interannual
variability of monthly TWS variations. As observed in this figure, in general, the
Terrestrial water storage at Illinois
mm/month
300
OBS
SIM
200
100
–100
–200
–300
1 9 8 4
1 9 8 5
1 9 8 6
1 9 8 7
1 9 8 8
1 9 8 9
1 9 9 0
1 9 9 1
1 9 9 2
1 9 9 3
1 9 9 4
1 9 9 5
1 9 9 6
1 9 9 7
1 9 9 8
1 9 9 9
2 0 0 0
2 0 0 1
2 0 0 2
2 0 0 3
2 0 0 4
2 0 0 5
0
FIGURE 20.6 Comparison of 1984–2005 monthly TWSA simulated by MATSIRO with
corresponding observations in Illinois.