

468
Multiscale Hydrologic Remote Sensing: Perspectives and Applications
However, in extratropical regions, VPD from NCEP1 is a little underestimated,
and this would have much less effect on ET estimations because of the internal
offsets by VPD itself in the ET algorithm. Low VPD can underestimate ET in the
P–M equation, while low VPD can also relax water constraints on stomatal conductance, because most ecosystems in these regions are controlled by water availability
(Nemani et al. 2003), resulting in overestimated ET. Therefore, the highest ET by
NCEP1 in the extratropical regions is largely caused by the highest S↓ s in NCEP1,
as shown in Figure 19.12e. On the basis of our previous similar work on MODIS
GPP/NPP (Zhao et al. 2006), the way in which meteorological variables influence
MODIS ET are somewhat different from that in MODIS GPP/NPP and are more
complex.
ET by GMAO
(mm ∙ year –1 )
ET by ERA40
(mm ∙ year –1 )
ET by NCEP1
(mm ∙ year –1 )
1200
1000
800
600
400
200
0
1200
1000
800
600
400
200
0
1200
1000
800
600
400
200
0
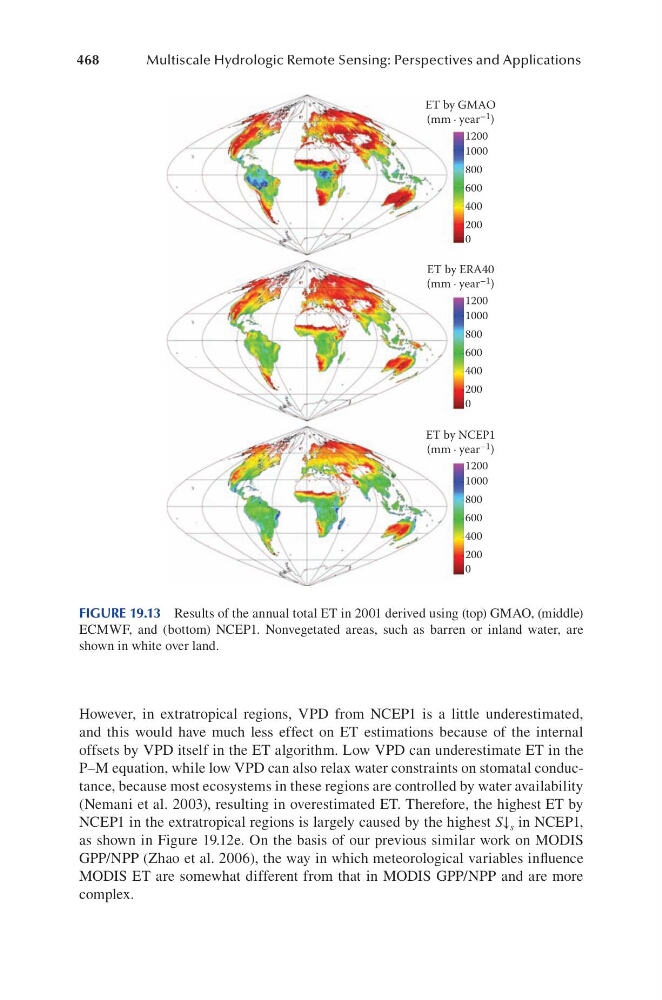
FIGURE 19.13 Results of the annual total ET in 2001 derived using (top) GMAO, (middle)
ECMWF, and (bottom) NCEP1. Nonvegetated areas, such as barren or inland water, are
shown in white over land.
Multiscale Hydrologic Remote Sensing: Perspectives and Applications
However, in extratropical regions, VPD from NCEP1 is a little underestimated,
and this would have much less effect on ET estimations because of the internal
offsets by VPD itself in the ET algorithm. Low VPD can underestimate ET in the
P–M equation, while low VPD can also relax water constraints on stomatal conductance, because most ecosystems in these regions are controlled by water availability
(Nemani et al. 2003), resulting in overestimated ET. Therefore, the highest ET by
NCEP1 in the extratropical regions is largely caused by the highest S↓ s in NCEP1,
as shown in Figure 19.12e. On the basis of our previous similar work on MODIS
GPP/NPP (Zhao et al. 2006), the way in which meteorological variables influence
MODIS ET are somewhat different from that in MODIS GPP/NPP and are more
complex.
ET by GMAO
(mm ∙ year –1 )
ET by ERA40
(mm ∙ year –1 )
ET by NCEP1
(mm ∙ year –1 )
1200
1000
800
600
400
200
0
1200
1000
800
600
400
200
0
1200
1000
800
600
400
200
0
FIGURE 19.13 Results of the annual total ET in 2001 derived using (top) GMAO, (middle)
ECMWF, and (bottom) NCEP1. Nonvegetated areas, such as barren or inland water, are
shown in white over land.