

466
Multiscale Hydrologic Remote Sensing: Perspectives and Applications
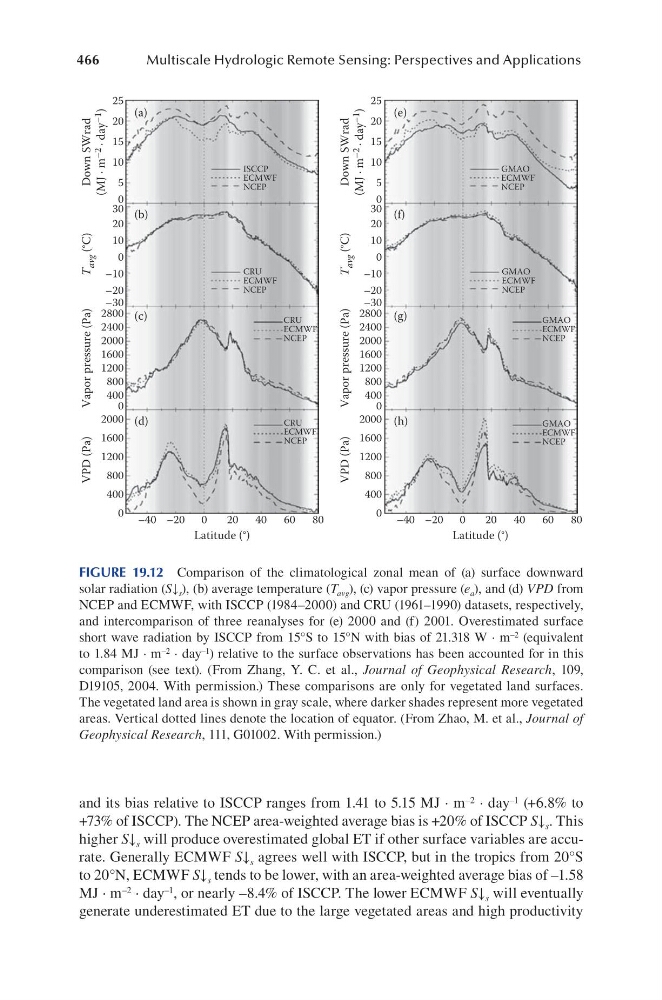
and its bias relative to ISCCP ranges from 1.41 to 5.15 MJ ∙ m –2 ∙ day –1 (+6.8% to
+73% of ISCCP). The NCEP area-weighted average bias is +20% of ISCCP S↓ s . This
higher S↓ s will produce overestimated global ET if other surface variables are accurate. Generally ECMWF S↓ s agrees well with ISCCP, but in the tropics from 20°S
to 20°N, ECMWF S↓ s tends to be lower, with an area-weighted average bias of –1.58
MJ ∙ m –2 ∙ day –1 , or nearly –8.4% of ISCCP. The lower ECMWF S↓ s will eventually
generate underestimated ET due to the large vegetated areas and high productivity
25
20
15
10
5
0
30
20
10
–10
–20
–40 –20 0
20
40
60
80
Latitude (°)
–40 –20 0
20
40
60
80
Latitude (°)
VPD (Pa)
Vapor pressure (Pa)
T
avg (°C)
Down SWrad
(MJ ∙ m –2
∙ day –1
)
–30
2800
2400
2000
1600
1200
800
400
0
2000
1600
1200
800
400
0
0
25
20
15
10
5
0
30
20
10
–10
–20
VPD (Pa)
Vapor pressure (Pa)
T
avg (°C)
Down SWrad
(MJ ∙ m –2
∙ day –1
)
–30
2800
2400
2000
1600
1200
800
400
0
2000
1600
1200
800
400
0
0
ISCCP
ECMWF
NCEP
CRU
ECMWF
NCEP
CRU
ECMWF
NCEP
CRU
ECMWF
NCEP
GMAO
ECMWF
NCEP
GMAO
ECMWF
NCEP
GMAO
ECMWF
NCEP
GMAO
ECMWF
NCEP
(a)
(b)
(c)
(d)
(e)
(f)
(g)
(h)
FIGURE 19.12 Comparison of the climatological zonal mean of (a) surface downward
solar radiation (S↓ s ), (b) average temperature (T avg ), (c) vapor pressure (e a ), and (d) VPD from
NCEP and ECMWF, with ISCCP (1984–2000) and CRU (1961–1990) datasets, respectively,
and intercomparison of three reanalyses for (e) 2000 and (f) 2001. Overestimated surface
short wave radiation by ISCCP from 15°S to 15°N with bias of 21.318 W · m –2 (equivalent
to 1.84 MJ ∙ m –2 ∙ day –1 ) relative to the surface observations has been accounted for in this
comparison (see text). (From Zhang, Y. C. et al., Journal of Geophysical Research, 109,
D19105, 2004. With permission.) These comparisons are only for vegetated land surfaces.
The vegetated land area is shown in gray scale, where darker shades represent more vegetated
areas. Vertical dotted lines denote the location of equator. (From Zhao, M. et al., Journal of
Geophysical Research, 111, G01002. With permission.)
Multiscale Hydrologic Remote Sensing: Perspectives and Applications
and its bias relative to ISCCP ranges from 1.41 to 5.15 MJ ∙ m –2 ∙ day –1 (+6.8% to
+73% of ISCCP). The NCEP area-weighted average bias is +20% of ISCCP S↓ s . This
higher S↓ s will produce overestimated global ET if other surface variables are accurate. Generally ECMWF S↓ s agrees well with ISCCP, but in the tropics from 20°S
to 20°N, ECMWF S↓ s tends to be lower, with an area-weighted average bias of –1.58
MJ ∙ m –2 ∙ day –1 , or nearly –8.4% of ISCCP. The lower ECMWF S↓ s will eventually
generate underestimated ET due to the large vegetated areas and high productivity
25
20
15
10
5
0
30
20
10
–10
–20
–40 –20 0
20
40
60
80
Latitude (°)
–40 –20 0
20
40
60
80
Latitude (°)
VPD (Pa)
Vapor pressure (Pa)
T
avg (°C)
Down SWrad
(MJ ∙ m –2
∙ day –1
)
–30
2800
2400
2000
1600
1200
800
400
0
2000
1600
1200
800
400
0
0
25
20
15
10
5
0
30
20
10
–10
–20
VPD (Pa)
Vapor pressure (Pa)
T
avg (°C)
Down SWrad
(MJ ∙ m –2
∙ day –1
)
–30
2800
2400
2000
1600
1200
800
400
0
2000
1600
1200
800
400
0
0
ISCCP
ECMWF
NCEP
CRU
ECMWF
NCEP
CRU
ECMWF
NCEP
CRU
ECMWF
NCEP
GMAO
ECMWF
NCEP
GMAO
ECMWF
NCEP
GMAO
ECMWF
NCEP
GMAO
ECMWF
NCEP
(a)
(b)
(c)
(d)
(e)
(f)
(g)
(h)
FIGURE 19.12 Comparison of the climatological zonal mean of (a) surface downward
solar radiation (S↓ s ), (b) average temperature (T avg ), (c) vapor pressure (e a ), and (d) VPD from
NCEP and ECMWF, with ISCCP (1984–2000) and CRU (1961–1990) datasets, respectively,
and intercomparison of three reanalyses for (e) 2000 and (f) 2001. Overestimated surface
short wave radiation by ISCCP from 15°S to 15°N with bias of 21.318 W · m –2 (equivalent
to 1.84 MJ ∙ m –2 ∙ day –1 ) relative to the surface observations has been accounted for in this
comparison (see text). (From Zhang, Y. C. et al., Journal of Geophysical Research, 109,
D19105, 2004. With permission.) These comparisons are only for vegetated land surfaces.
The vegetated land area is shown in gray scale, where darker shades represent more vegetated
areas. Vertical dotted lines denote the location of equator. (From Zhao, M. et al., Journal of
Geophysical Research, 111, G01002. With permission.)